What It Does
Aslan is a Monte Carlo simulation engine built in Pine Script. You give it your strategy parameters — win rate, risk/reward, position sizing, costs — and it plays out hundreds of possible futures, showing you the full distribution of outcomes.
The core insight: a strategy with positive expected value can still ruin you. Luck, sizing, and the clustering of losses into streaks all matter enormously, and none of that shows up in a simple backtest. Aslan forces it all into view before you commit real capital.
Add it to any TradingView chart (it runs in a separate pane), configure your parameters, and it draws the simulation output alongside a statistics table and optional side charts.
The Display
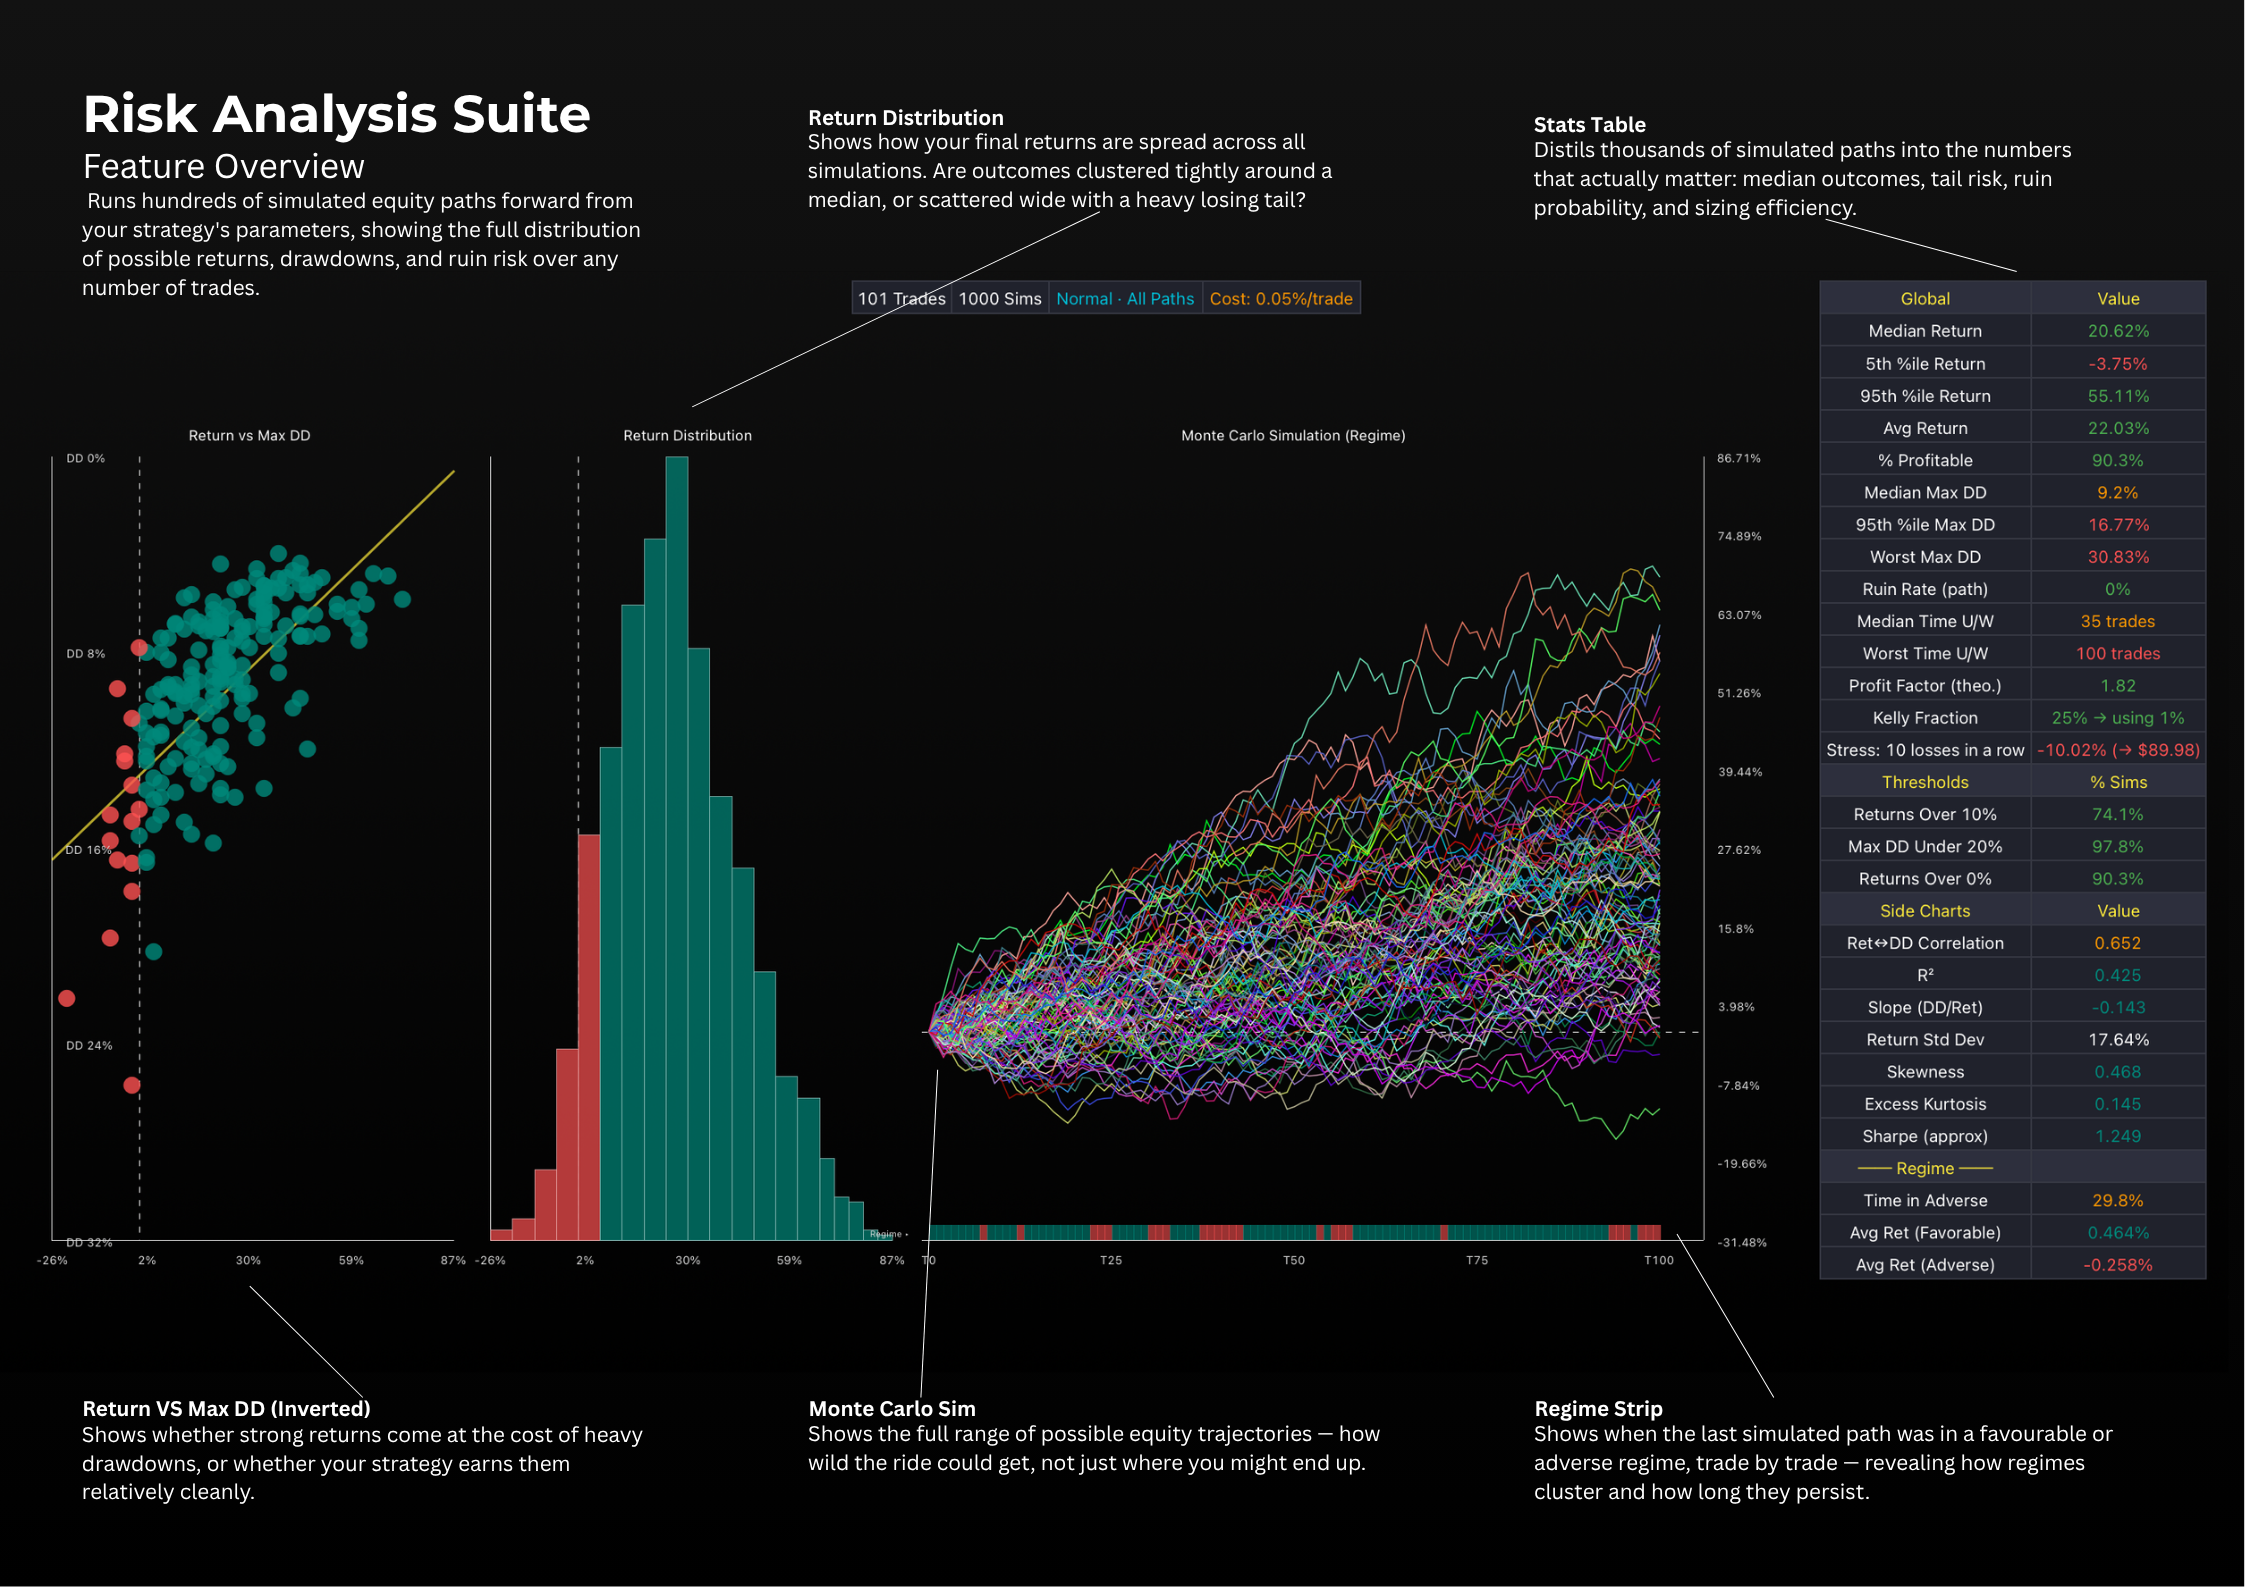
The central visual is the Monte Carlo plot: equity curves starting at 100, projected forward over your configured trade count. A dashed line at 100 marks breakeven. Any path that dips below the ruin threshold at any point counts as ruined, even if it later recovers.
All Paths draws every simulation as its own coloured line — best for seeing outliers and raw spread. Fan Chartcollapses everything into five percentile bands (p5/p25/p50/p75/p95) with a solid white median — cleaner and better for sharing. Best / Worst shows only the envelope — a quick sanity check on the absolute range.
When Regime Switching is on, a teal/red strip along the bottom of the chart shows which regime was active at each trade in the last simulation, so you can see how regime clusters drive drawdowns.
Side charts (optional) add a return distribution histogram to the left of the main plot — profitable outcomes in teal, losses in red — and a return vs max drawdown scatter with a regression line. A fat left tail on the histogram or a steep positive slope on the scatter are both warning signs worth investigating before trading.