Liquidity Levels
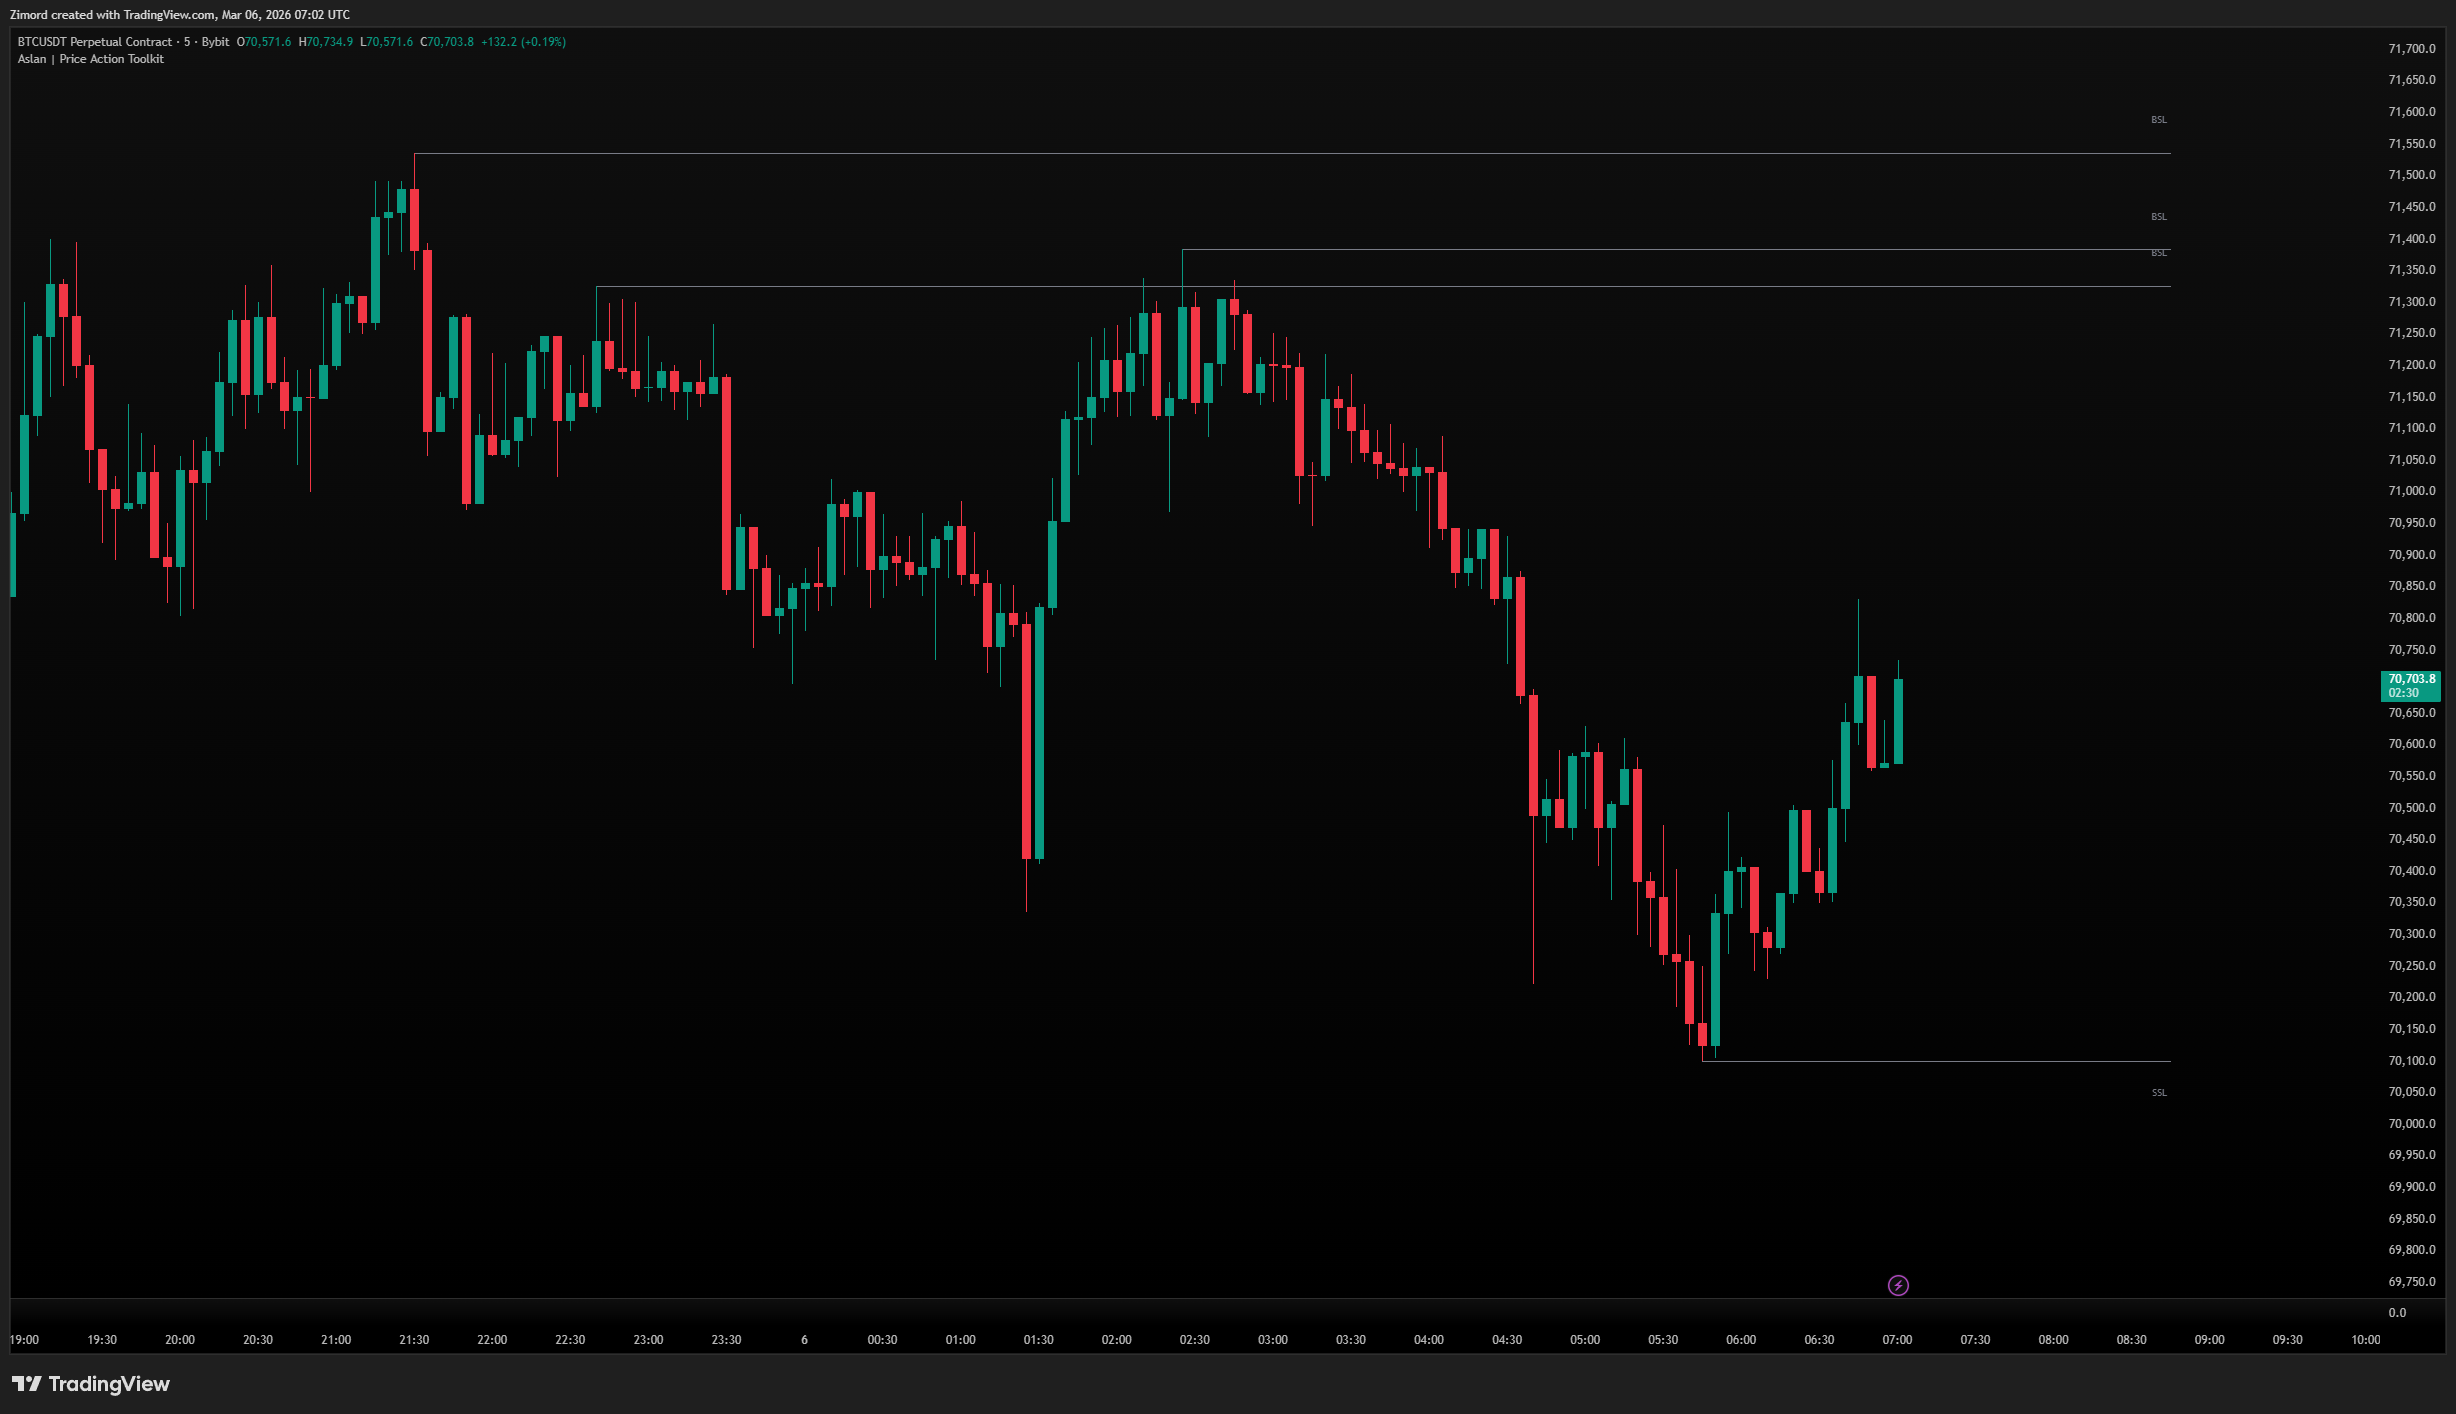
Liquidity levels mark the price areas where stop losses from retail traders are clustered. Institutional traders need large amounts of liquidity to fill their orders, so they actively drive price toward these stop clusters before reversing — a process commonly referred to as a liquidity sweep or stop hunt.
What it shows:
- BSL (Buy-Side Liquidity) — marked above swing highs, where traders who are short have placed their stop losses and where pending buy orders accumulate
- SSL (Sell-Side Liquidity) — marked below swing lows, where traders who are long have placed their stop losses and where pending sell orders accumulate
- Both levels are derived from significant pivot points, ensuring only meaningful liquidity pools are displayed
How to use it:
- Pivot Length controls how significant a swing needs to be to qualify as a liquidity level — higher values produce fewer but more meaningful levels, while lower values show more granular liquidity clusters
- Max Levels limits the number of levels displayed simultaneously, helping you focus on the most recent and relevant pools
- The Mitigated setting lets you choose whether swept levels are removed from the chart or kept visible as reference — keeping them visible can be useful to see the pattern of where price has already swept
- Method determines what constitutes a sweep — Close is stricter and only registers a sweep when price closes through the level, while Wick registers any penetration including wicks
- Display as Lines for a clean minimal look or Boxes to better visualize the zone width around each level
- Extend projects levels forward in time so they remain visible as the chart builds
Pro tip: When price sweeps a liquidity level then reverses with high volume, thats a great confluence for any strategy
Dealing Range
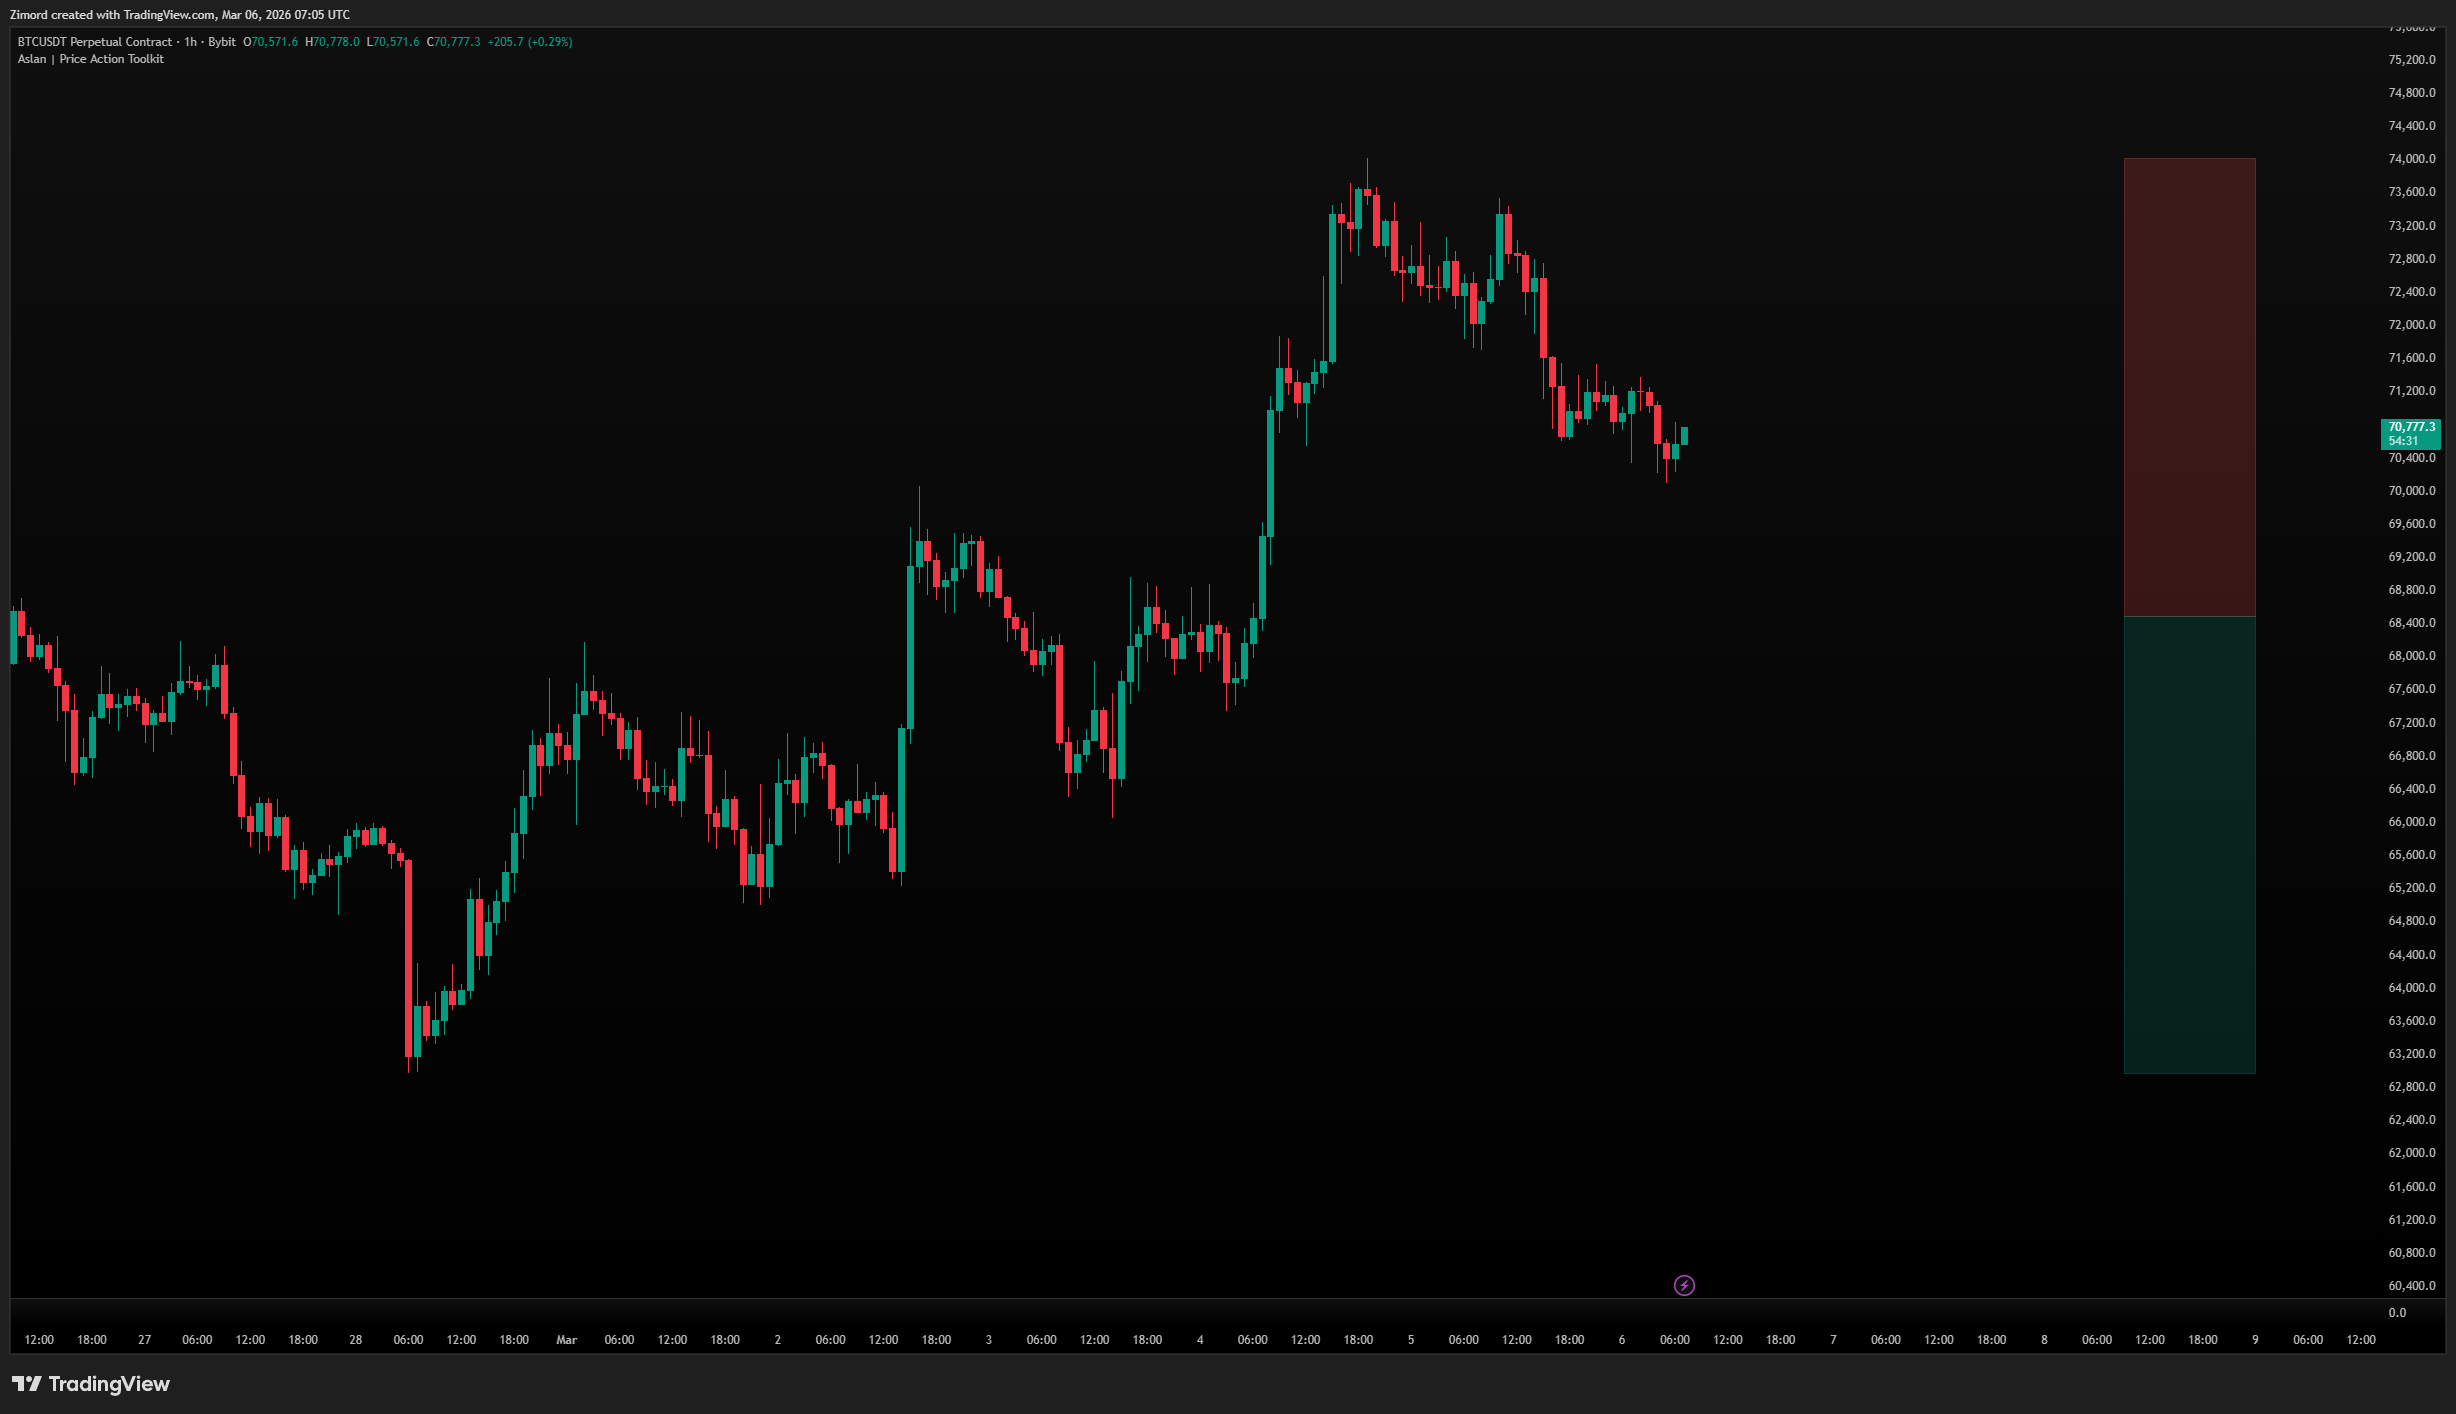
The Dealing Range shows the current trading range based on the highest high and lowest low over the last 200 bars, split into a premium (upper) and discount (lower) zone.
What it shows:
- Upper half (red) — Premium zone, where price is considered expensive (look for sells)
- Lower half (green) — Discount zone, where price is considered cheap (look for buys)
- The midpoint divides premium from discount
How to use it:
- The range displays as a small box to the right of price (offset-controlled)
- Use it to determine whether you should be looking for buy setups (price in discount) or sell setups (price in premium)
- Combine with OBs and FVGs — a bullish OB in the discount zone is a high-probability long setup
Point of Control (POC)
The POC is the price level with the highest traded volume over the lookback period — a key magnet level.
What it shows:
- A single horizontal line at the highest-volume price node
- "POC" label at the end of the line
How to use it:
- Enable/disable the line and label independently
- Customize line style (Solid, Dashed, Dotted), width, and color
- Price tends to gravitate toward the POC — it acts as both a magnet and a mean-reversion target
- If price is far from the POC, there's a statistical tendency for it to return