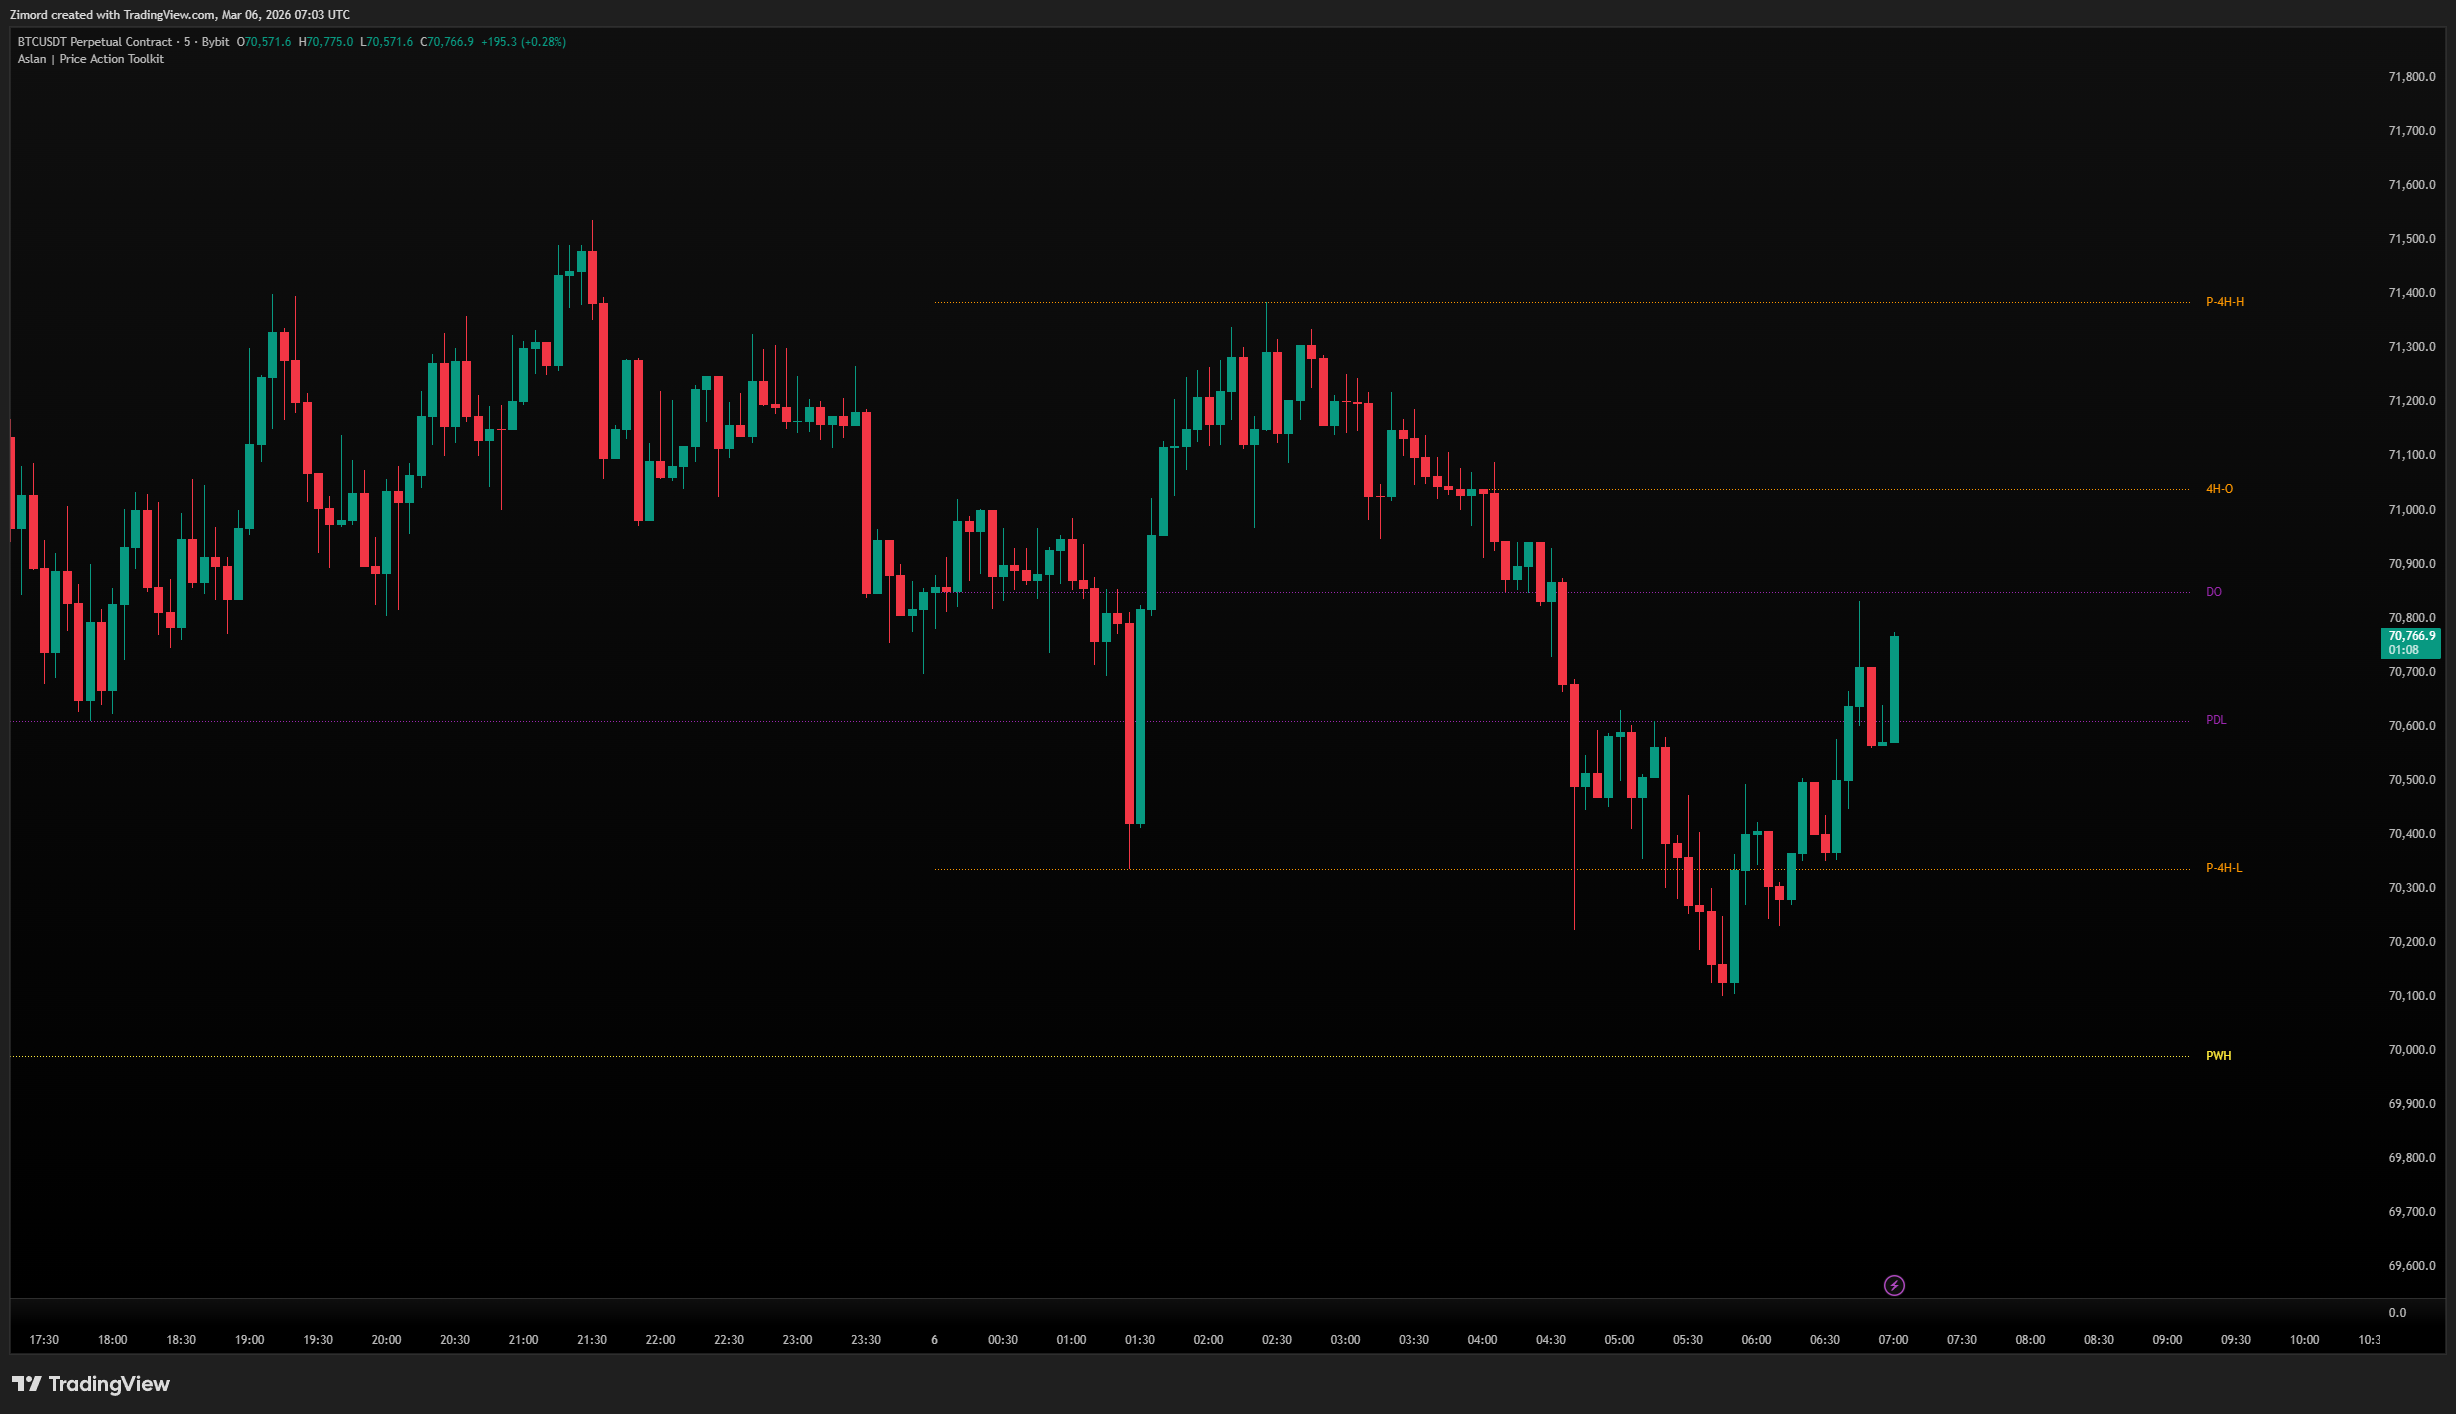
Key Levels
These are significant price levels derived from higher timeframe opens, highs, and lows — the levels institutions watch closely.
Available levels:
- 4H — Previous 4H High, Low, Open, Mid
- Daily — Previous Day High (PDH), Previous Day Low (PDL), Daily Open (DO)
- Monday — Monday High, Low, Mid (useful for weekly range analysis)
- Weekly — Previous Week High (PWH), Previous Week Low (PWL), Weekly Open (WO)
- Monthly — Previous Month High/Low/Open
- Quarterly — Previous Quarter High/Low/Open
- Yearly — Current Year High/Low/Open
How to use it:
- Enable only the timeframes relevant to your trading style
- Each level has its own color and line style — customize to reduce visual clutter
- Shorten option abbreviates the label text (e.g., "PDH" instead of "Previous Day High")
- If two levels fall at the same price, the labels merge automatically showing both names — a strong confluence signal
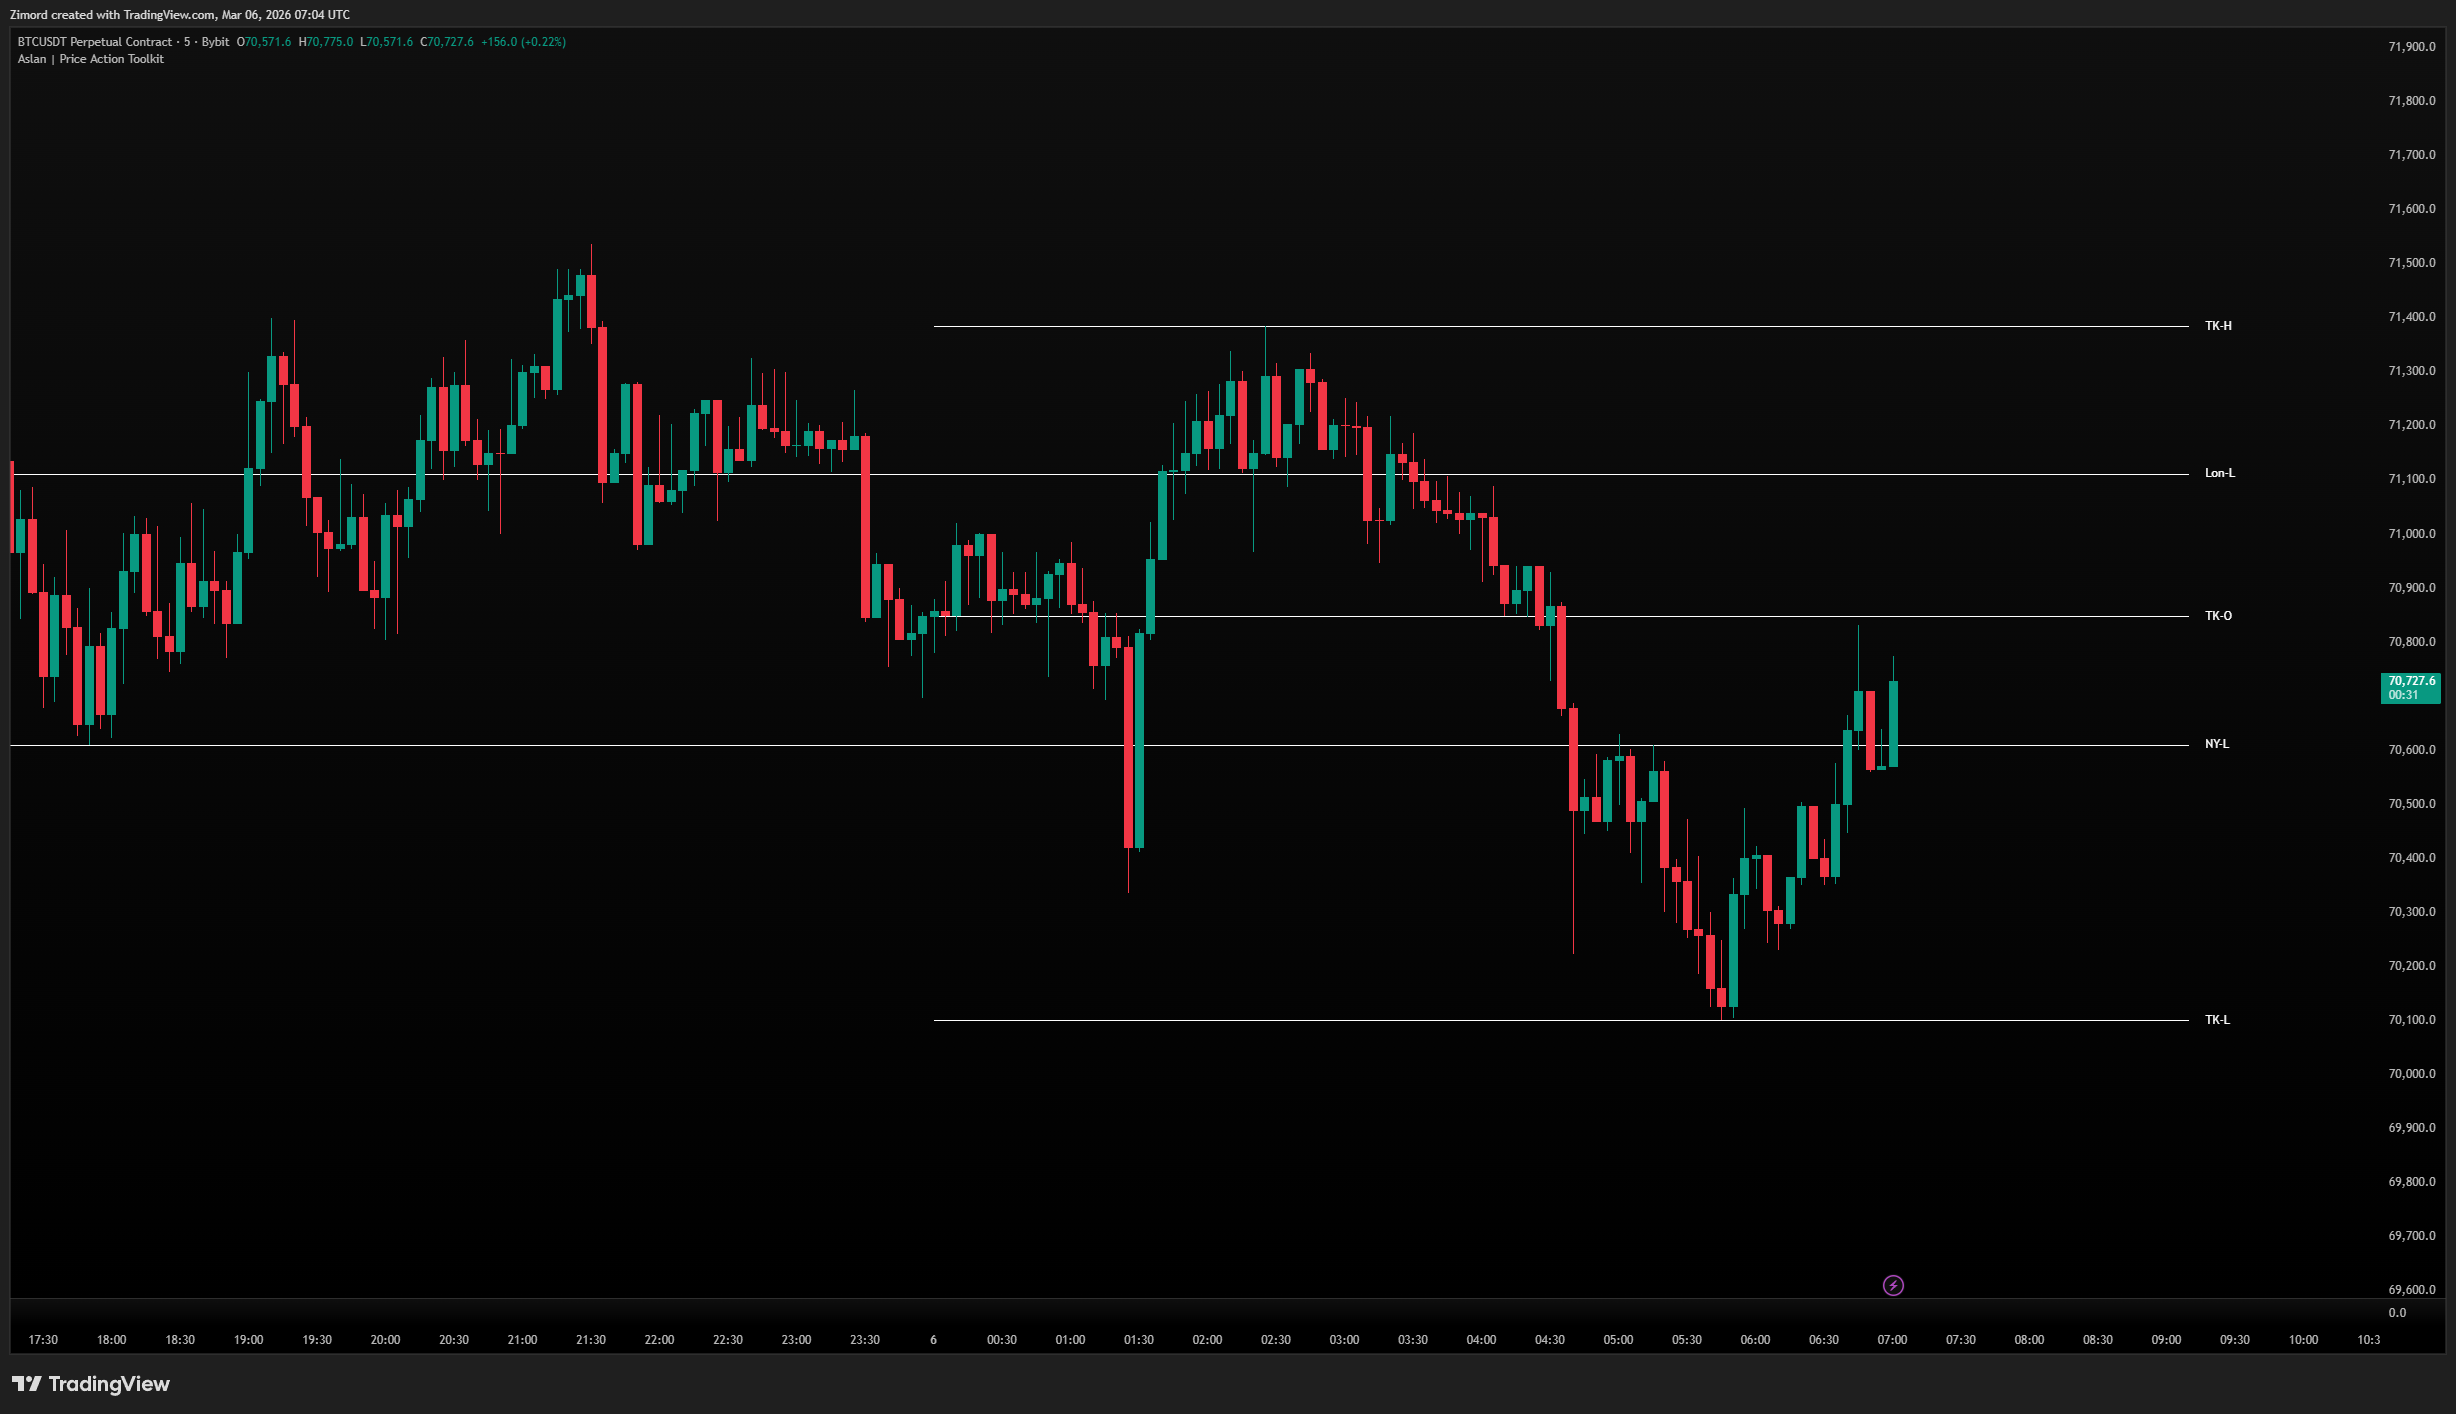
Session Levels
Marks the High, Low, and Open of the three major trading sessions.
Sessions available:
- London (08:00–16:00)
- New York (14:00–21:00)
- Tokyo/Asia (00:00–09:00)
How to use it:
- Enable each session independently
- Toggle O/C (Open/Close) and H/L (High/Low) separately per session
- The Shorten option gives abbreviated labels (e.g., "Lon-H" vs "London High")
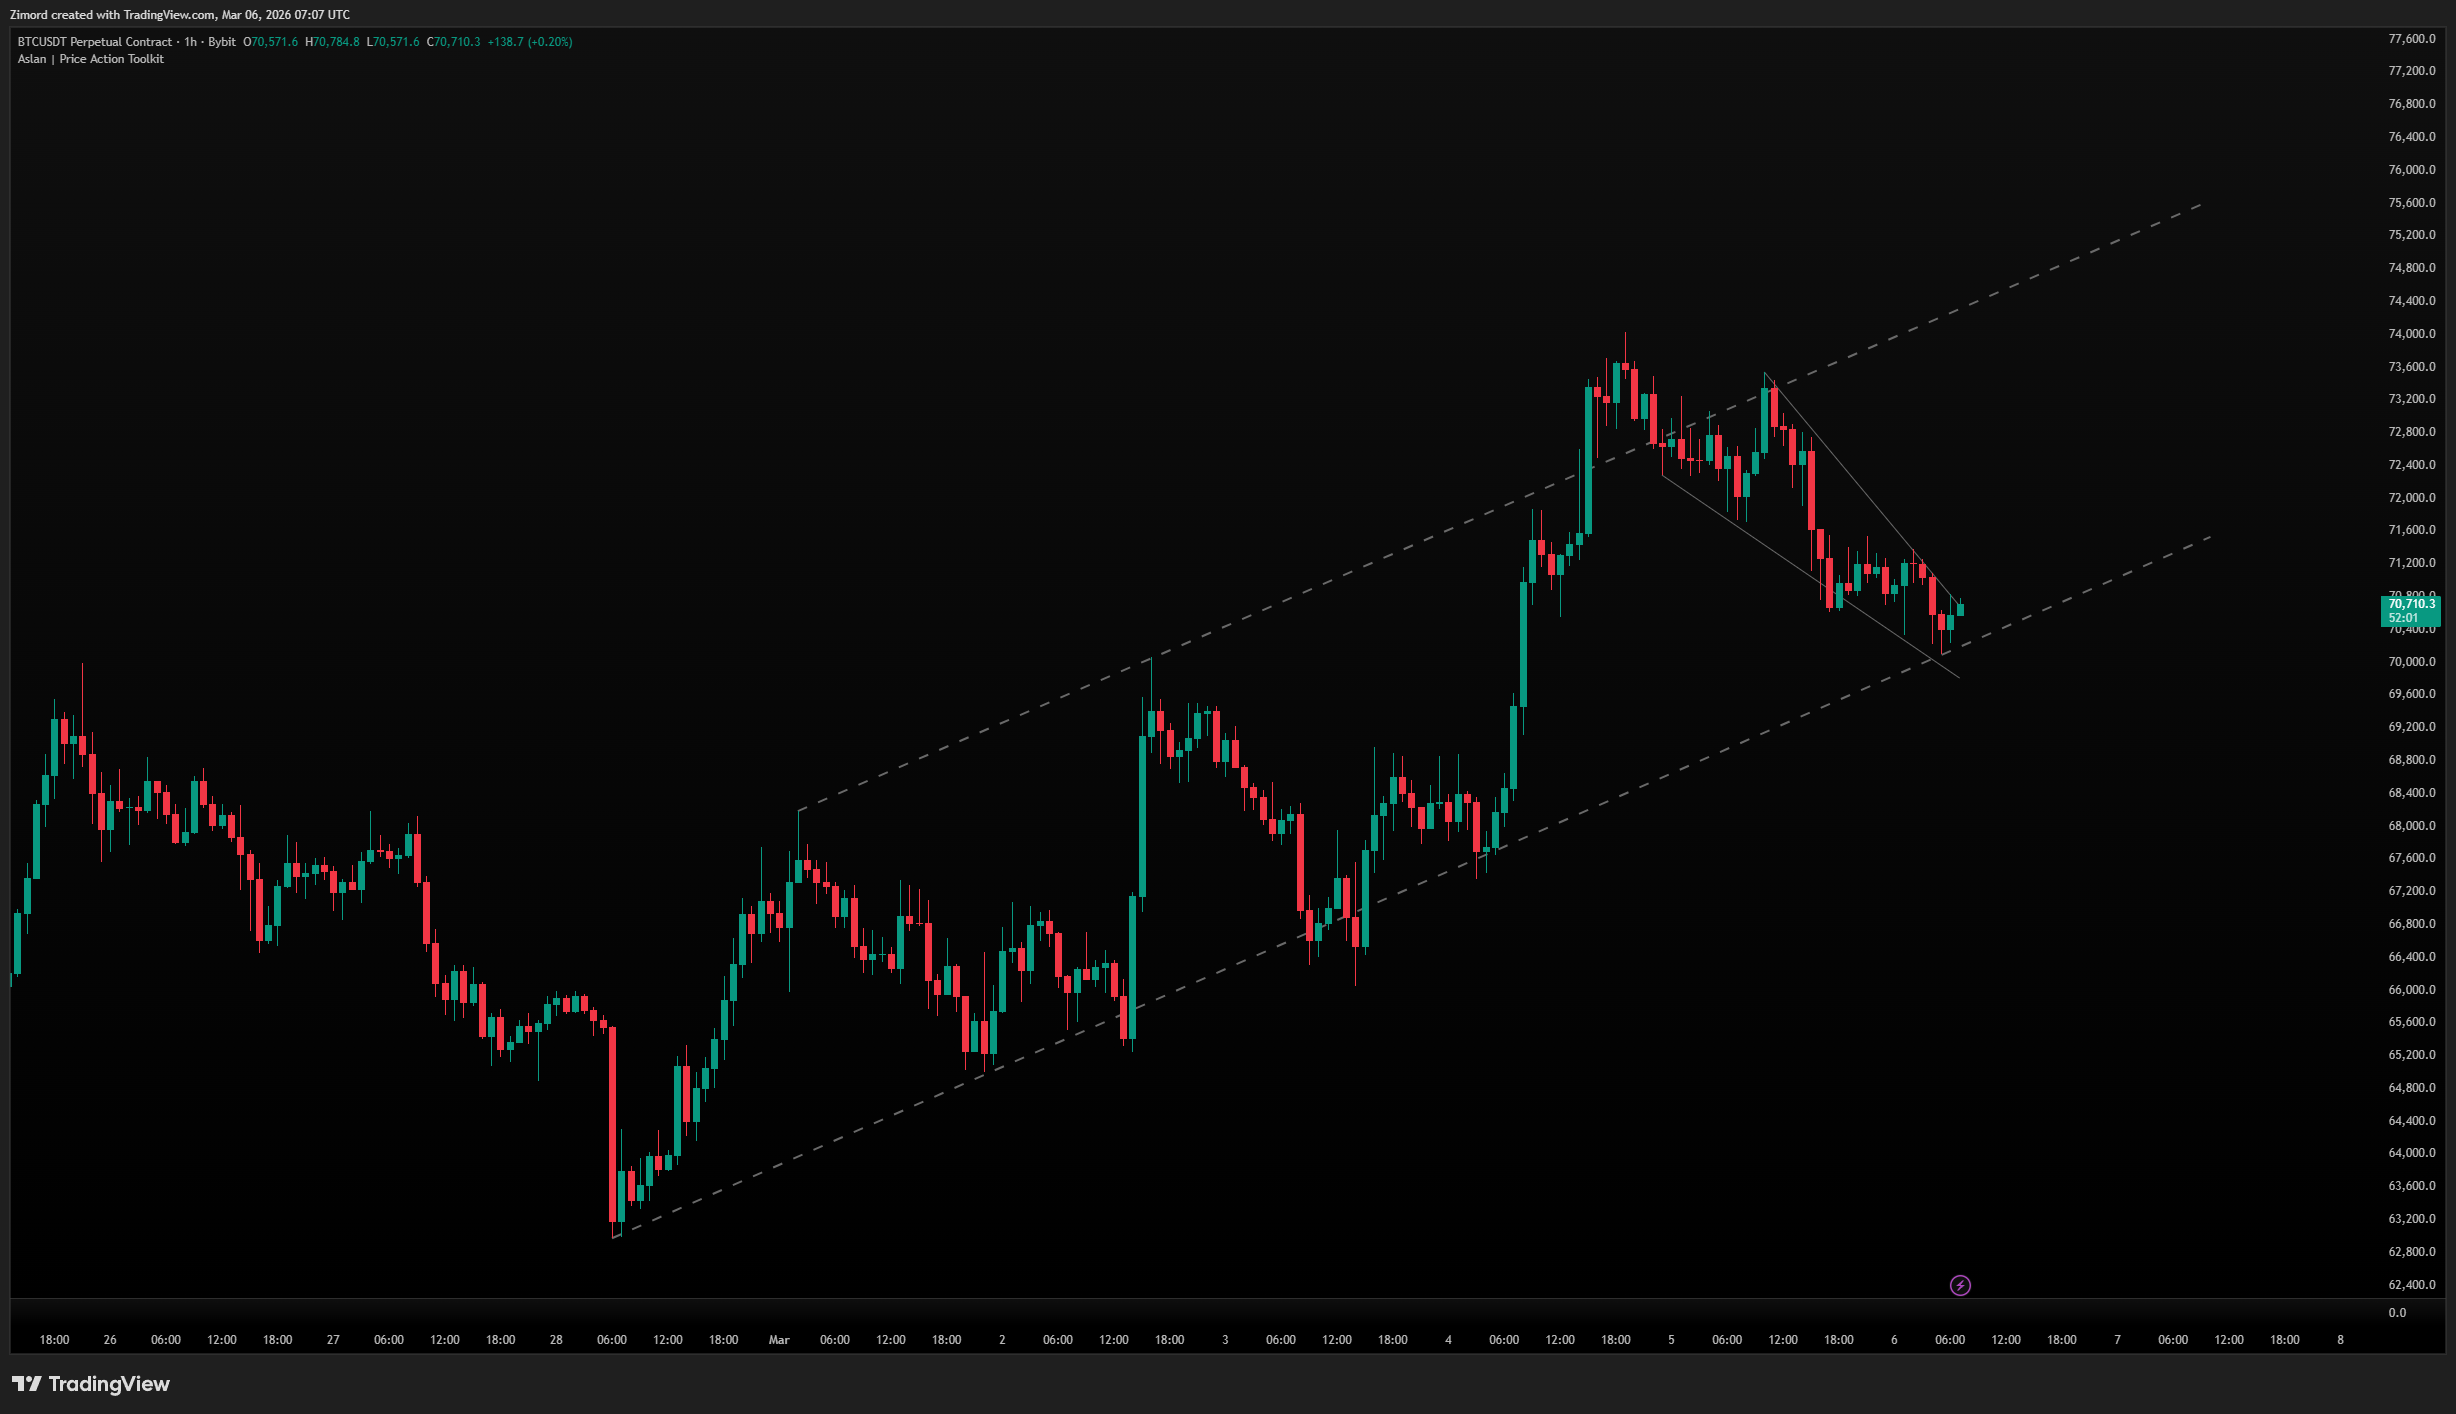
Trendlines
Automatically draws valid trendlines connecting swing highs and swing lows.
What it shows:
- Descending trendlines connecting lower highs
- Ascending trendlines connecting higher lows
- Broken trendlines shown in a different style
- Optional signals (X marks) where trendlines are broken
How to use it:
- Lookback controls how far back the indicator searches for pivot points — higher values find more significant trendlines
- Extend projects trendlines forward
- Show Broken keeps broken trendlines visible in a different style (e.g., dashed) so you can see where breaks occurred
- Max Broken limits how many broken trendlines stay on the chart
- Mitigation — choose whether a trendline is broken by Close or by High/Low wick
- Enable Show Signals to plot visual markers when a trendline is broken — useful for alerting