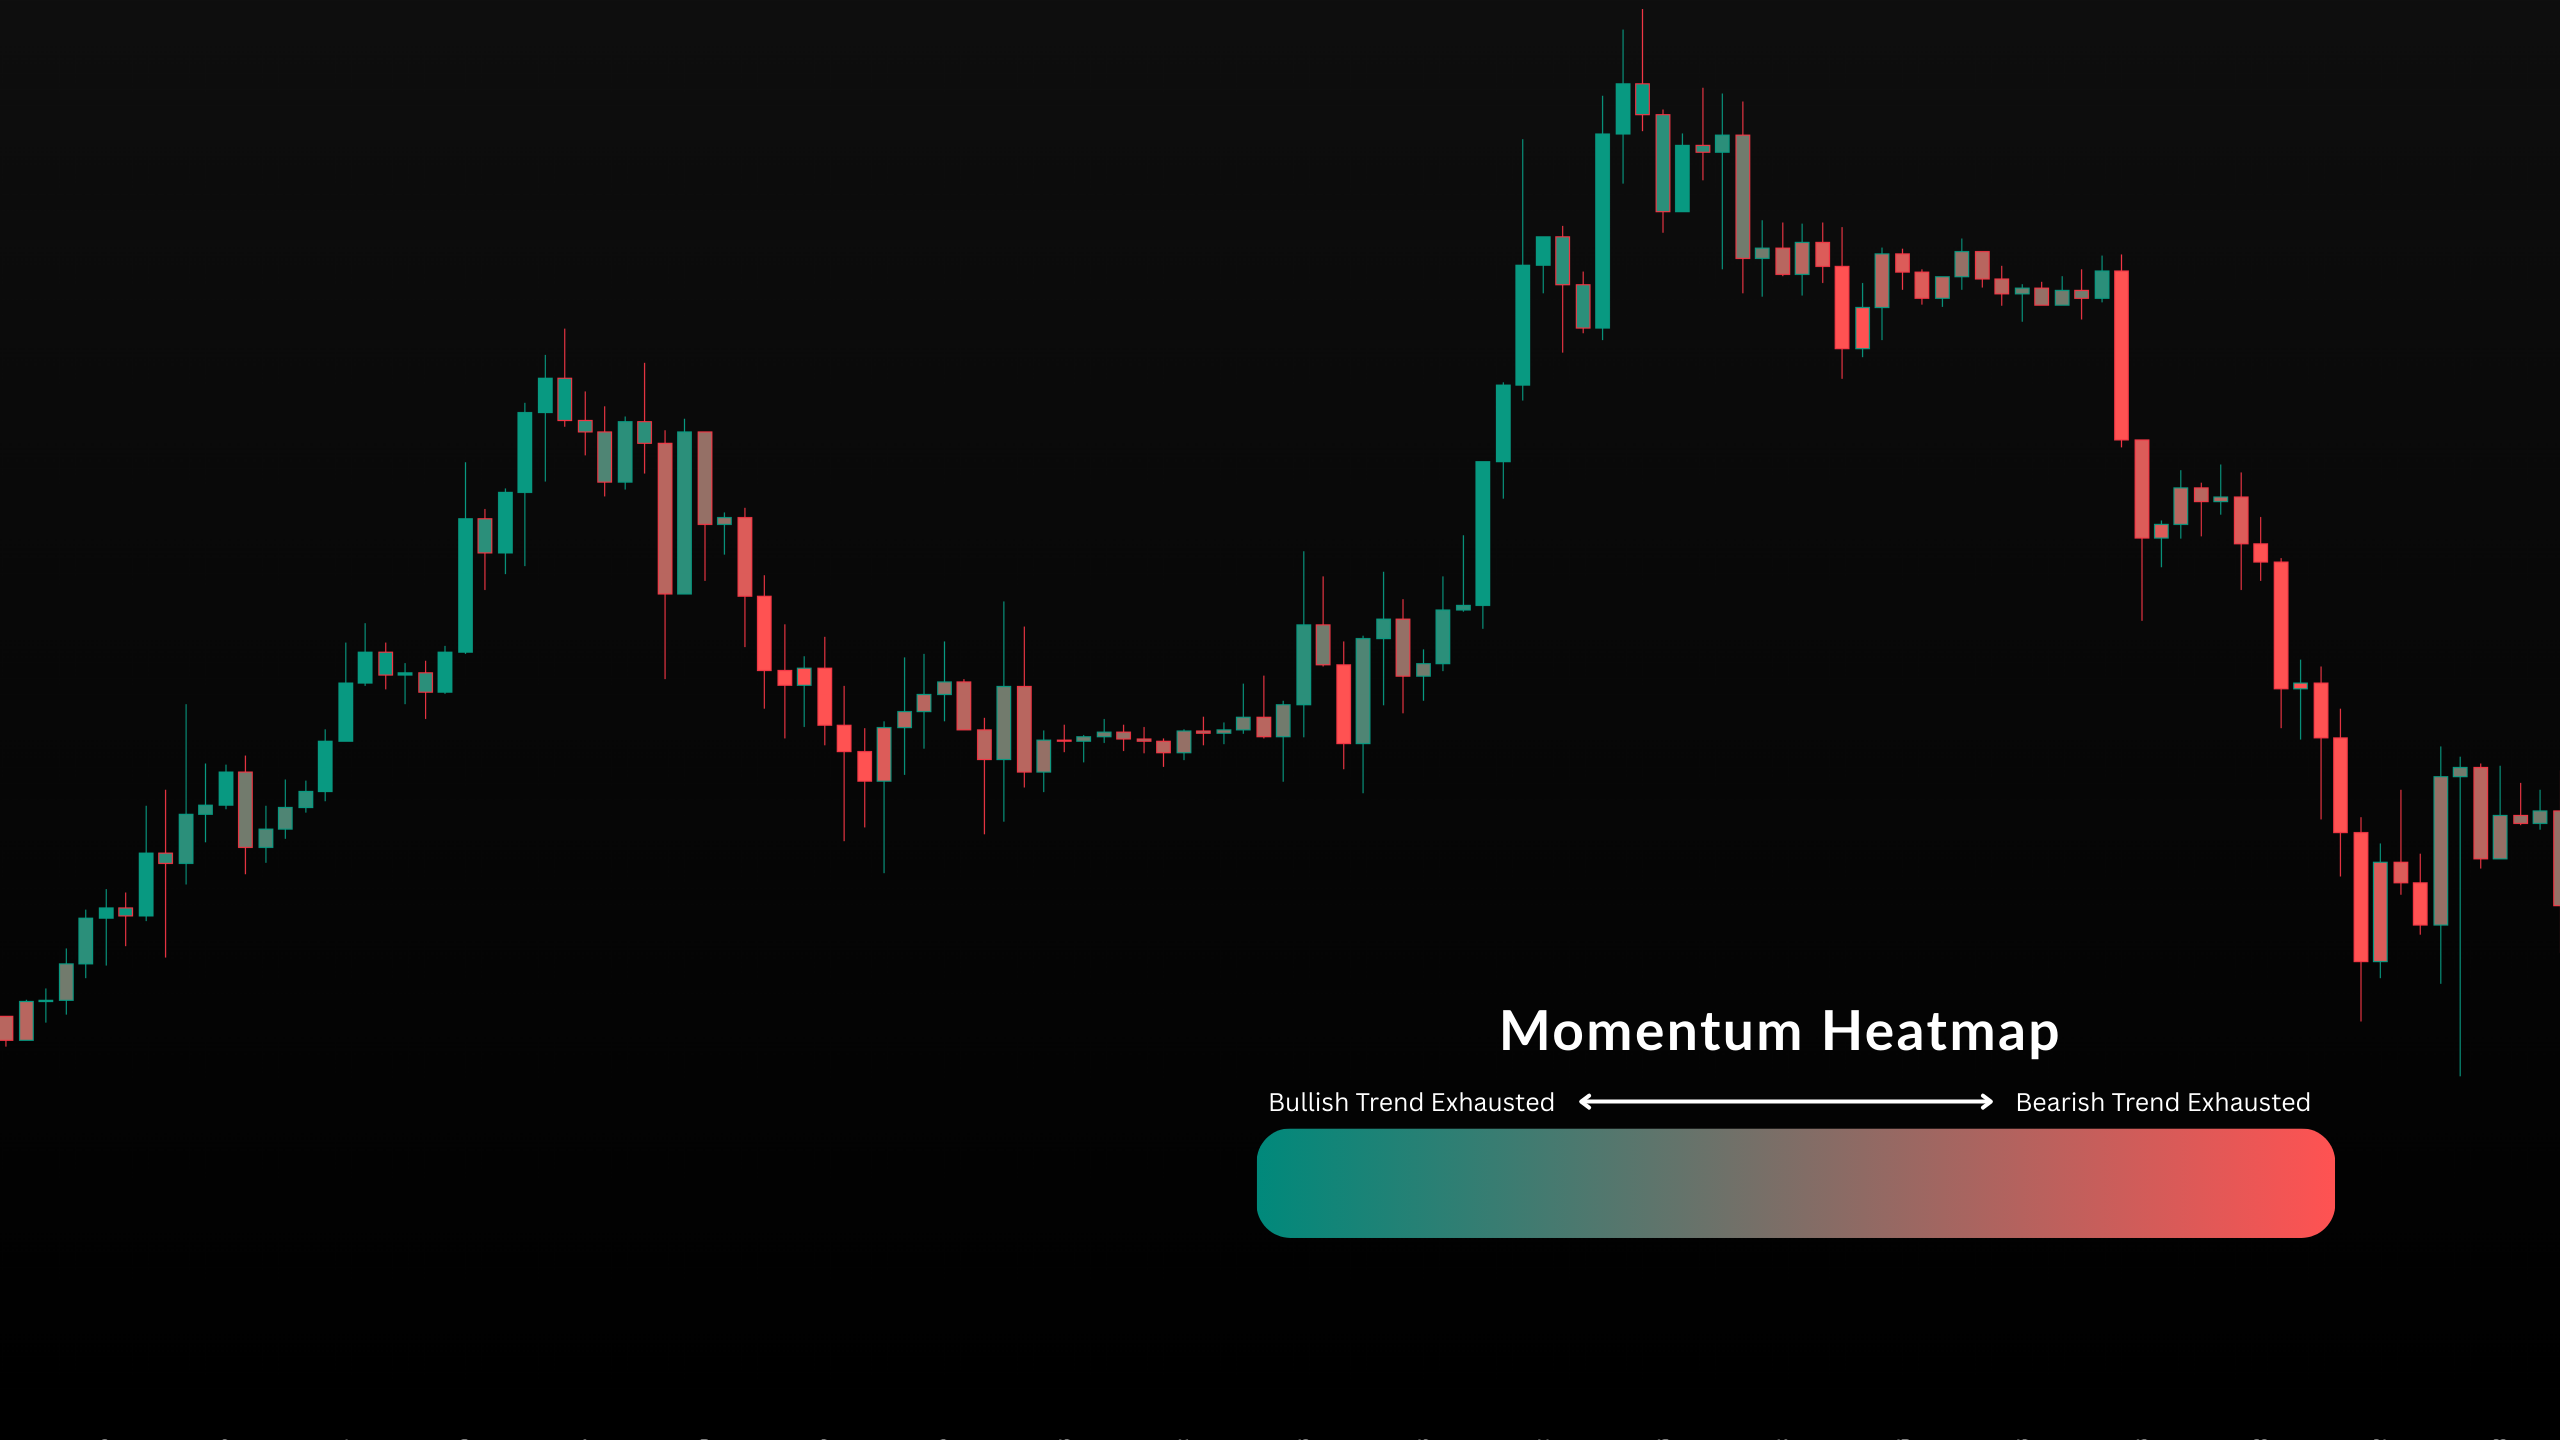
Momentum Heatmap (Bar Coloring)
The heatmap displays momentum strength directly on the candles. Strong color intensity reflects extreme conditions, while neutral tones indicate balance.
It is designed as confirmation, not a standalone signal. For example, a reversal signal during extreme momentum may increase the likelihood of a rotation. In trending conditions, strong momentum in the direction of the move supports continuation. It provides quick visual context for market strength.
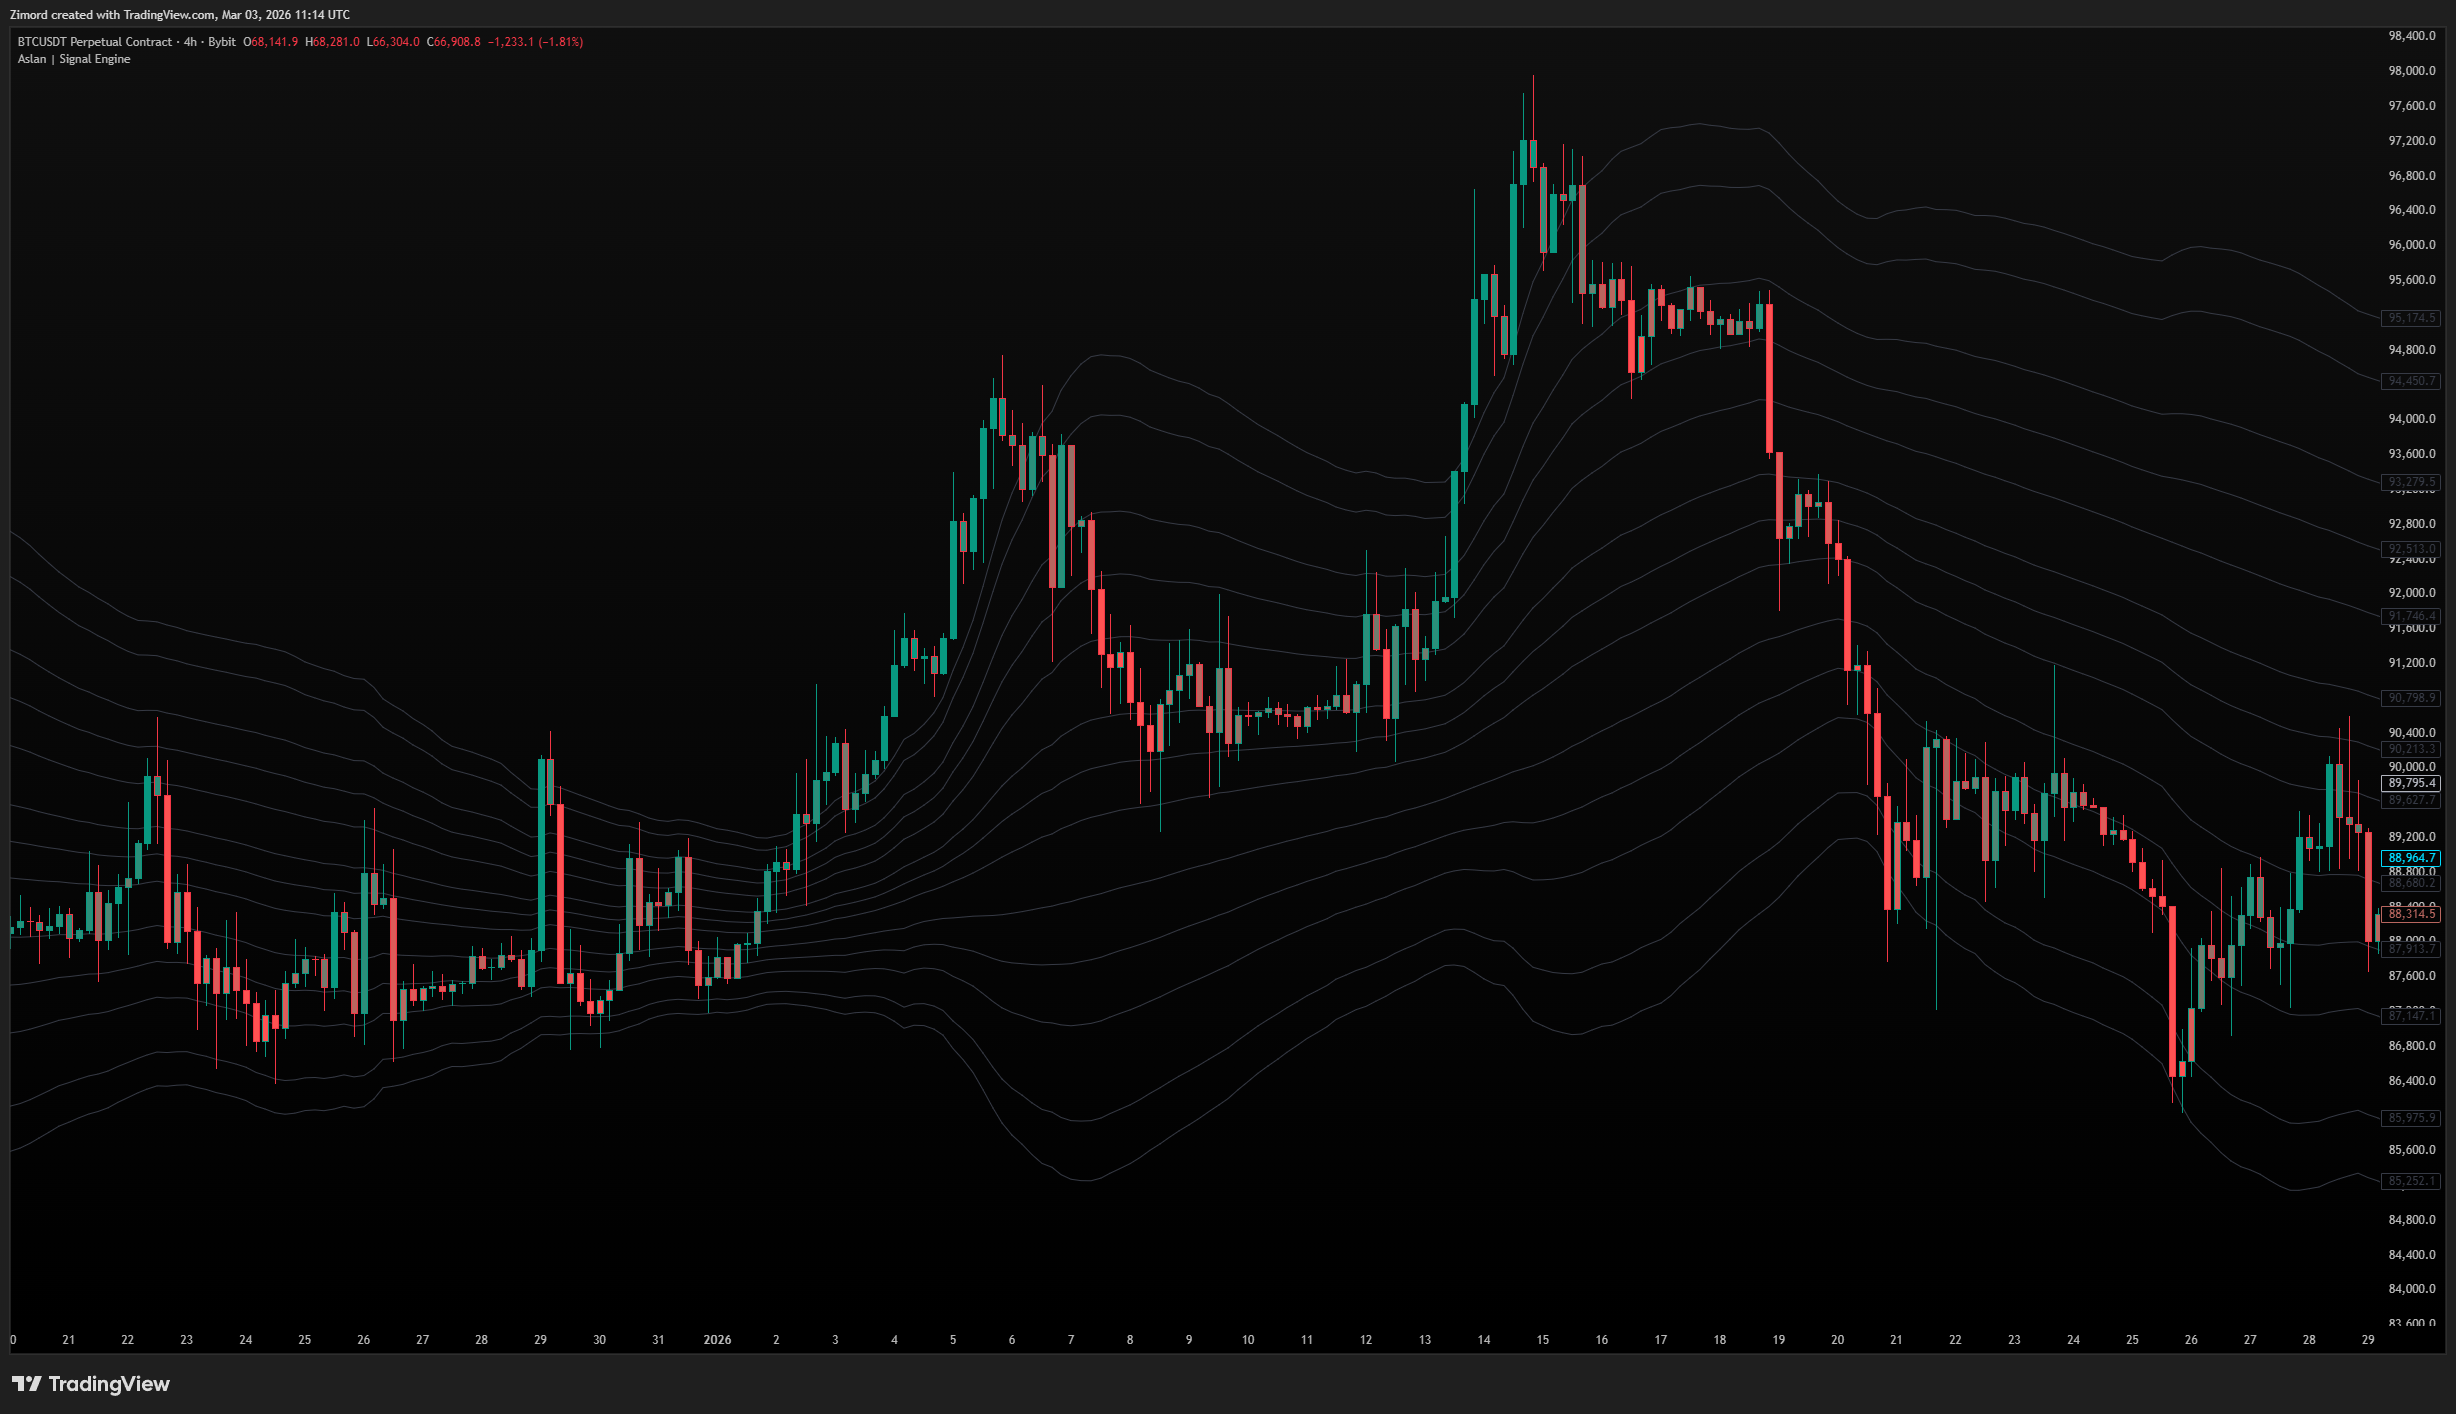
Volatility Bands
The volatility bands plot expanding and contracting envelopes around a central equilibrium line. Price reaching outer bands indicates expansion and potential overextension. Compression toward the center suggests consolidation. The width of the bands also indicate market regime, when the bands are close together, it signals price is consolidating and accumulating and when they are far apart, it signals expansion and distrubution.
Breakout traders may focus on sustained expansion beyond outer levels. Mean-reversion traders may look for rejection at extremes. The bands provide a structured view of volatility conditions.
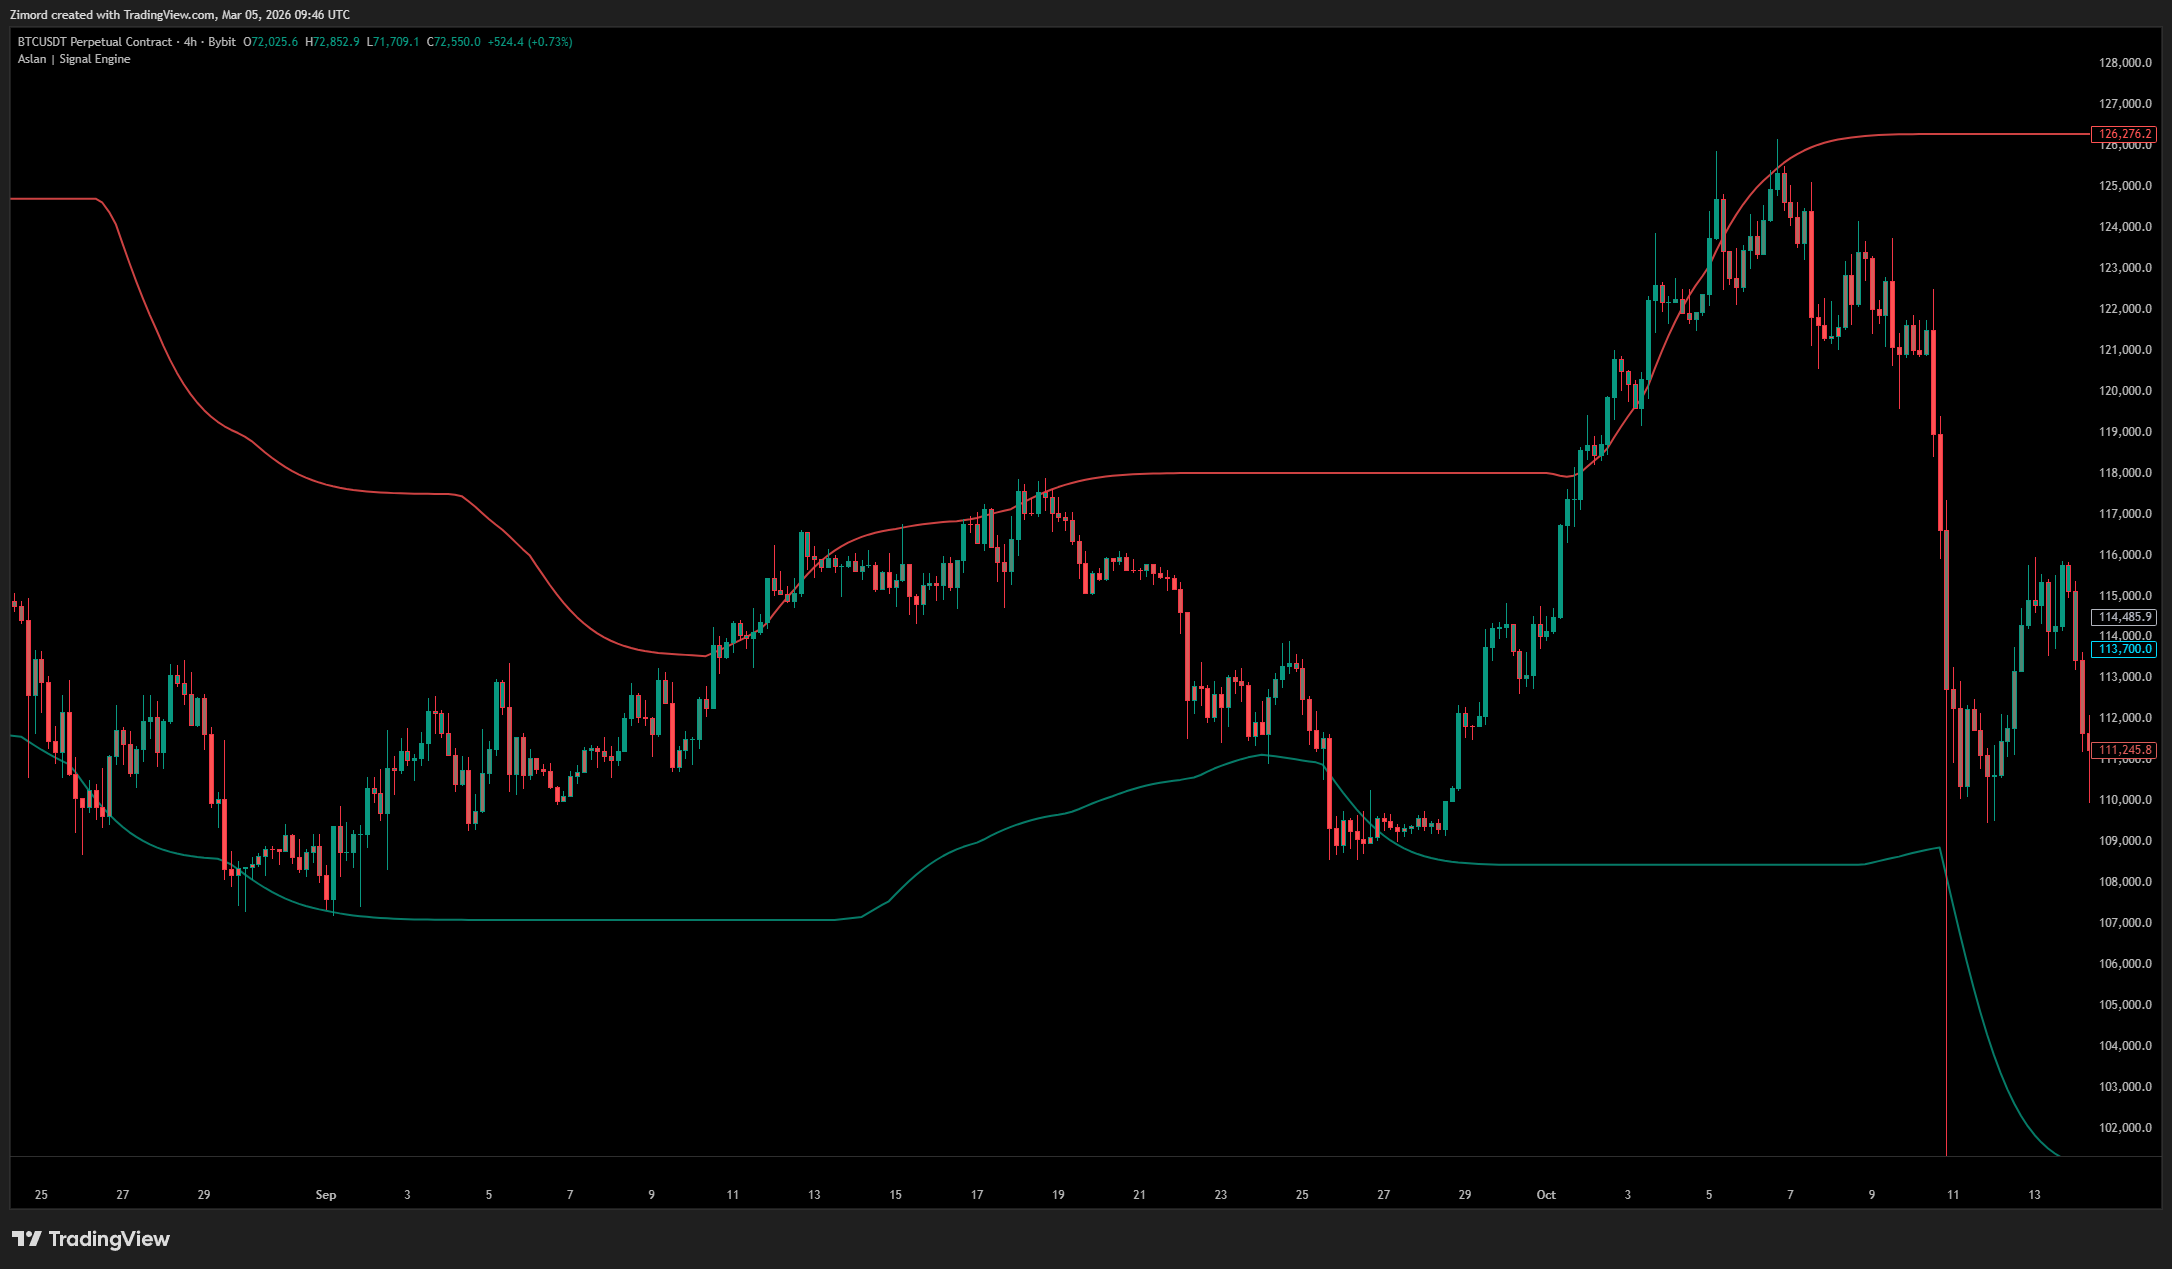
Kernel Support & Resistance
Kernel-based support and resistance zones adjust with price instead of remaining static. These zones highlight areas where reactions are statistically more likely.
Confluence improves when signals align with these zones. For example, buying near dynamic support in bullish conditions or selling near resistance in bearish conditions adds structural context.
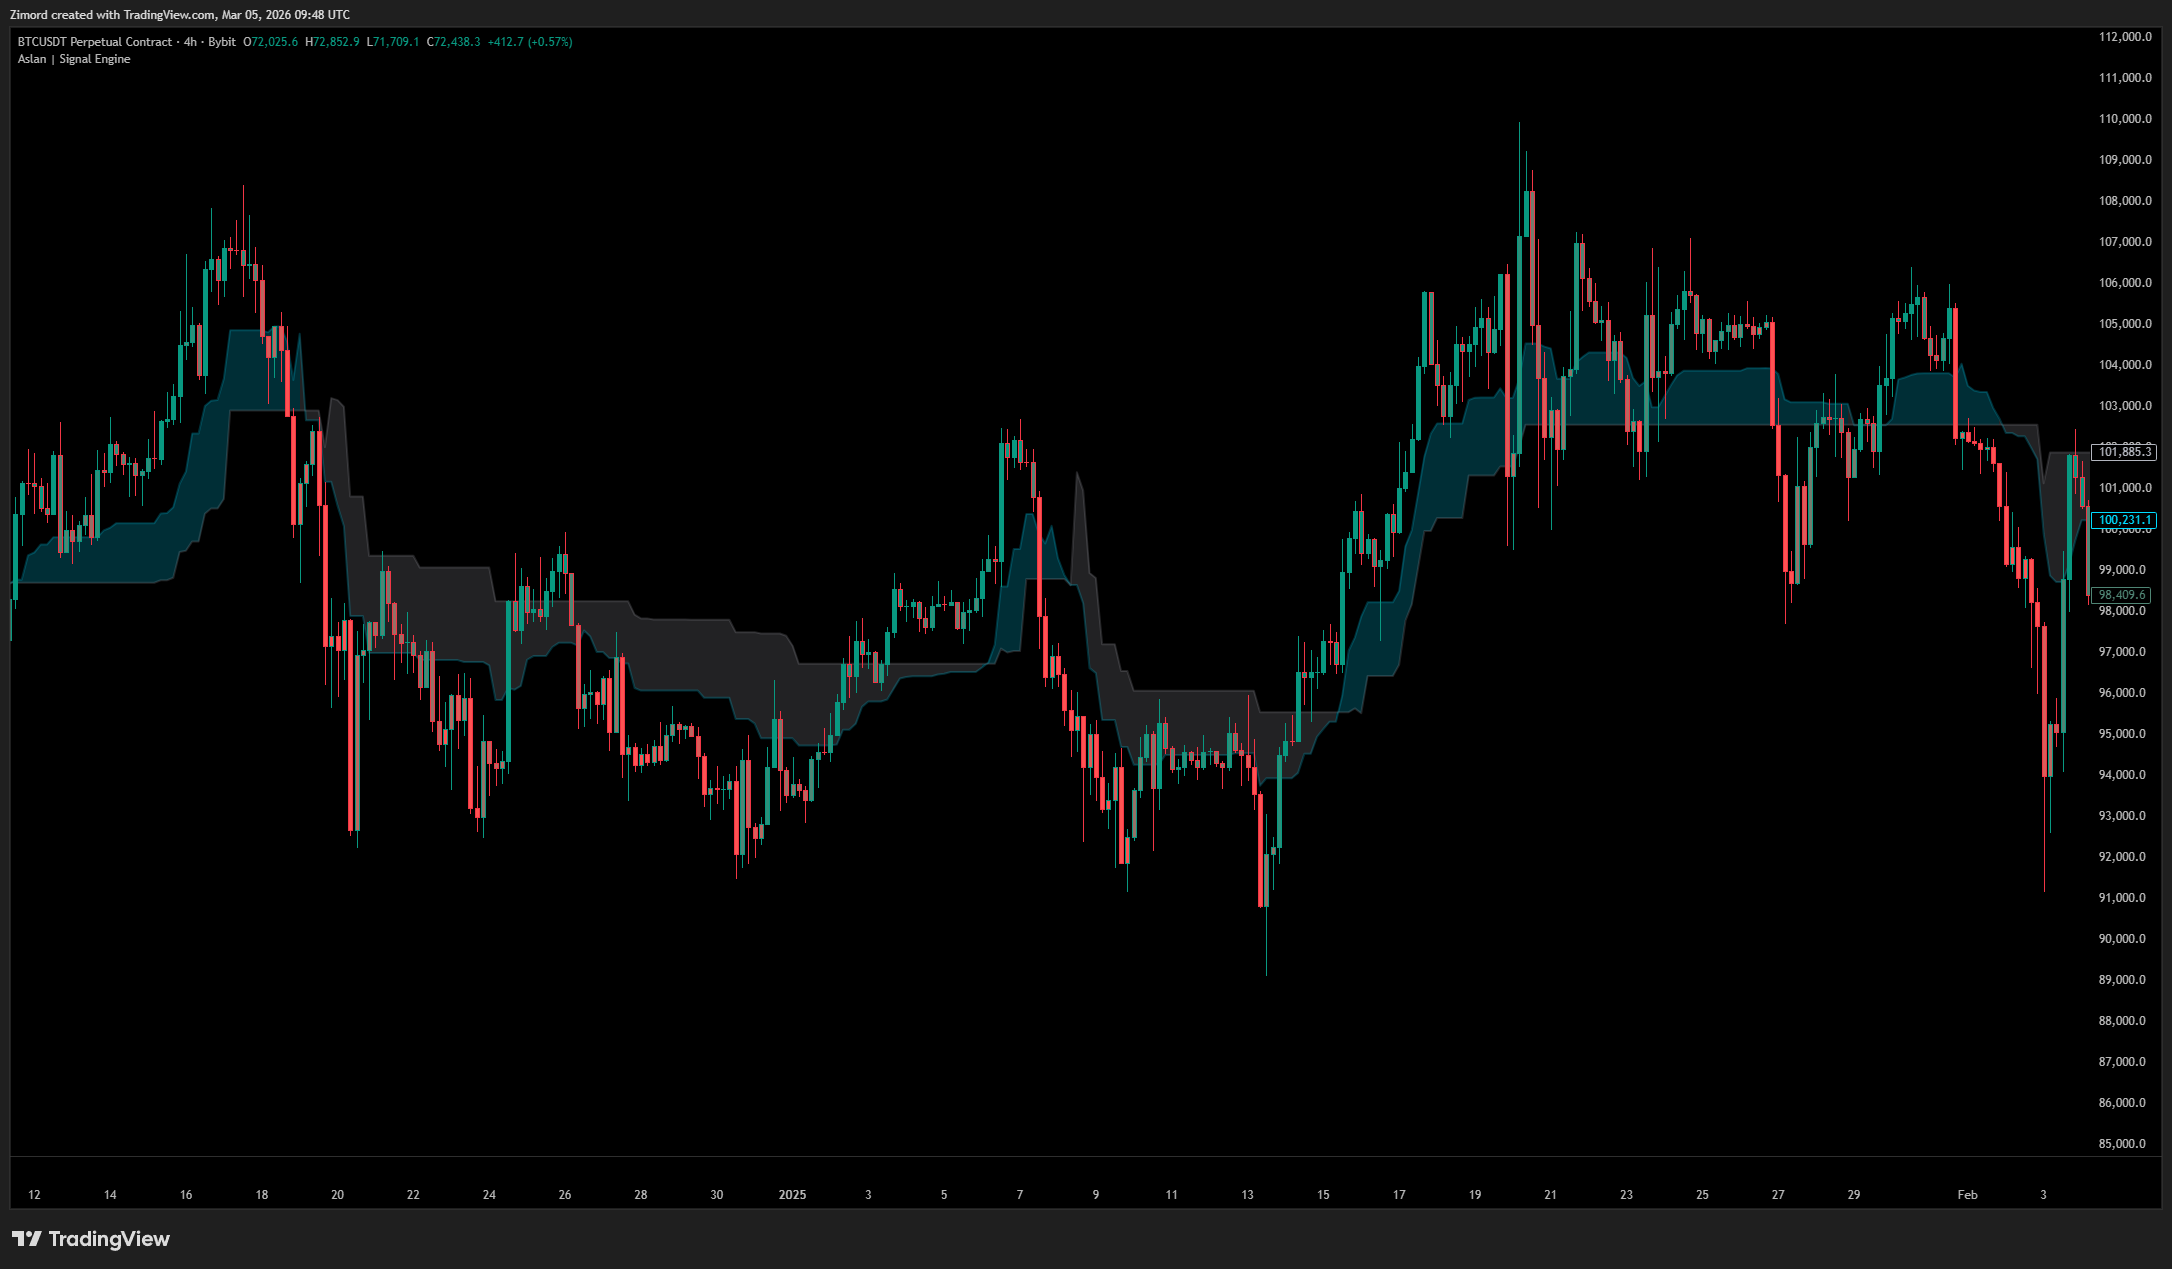
Senkou+ Cloud
The cloud provides higher-timeframe directional bias. Price above the cloud indicates bullish conditions. Price below suggests bearish conditions.
It functions primarily as a filter. Taking long trades above the cloud and short trades below can improve trade selection and reduce counter-trend exposure.